The Biscuits Project: decomposing the structure of cities
I did a talk on this project at the GeoMOB Edinburgh event on 1/10/2024. The slides are available, but I'll give a summary of the accompanying explanation content here.
The "Biscuits" project began back in September 2017. It was inspired by a work of art by Armelle Caron called Les Villes Rangees:
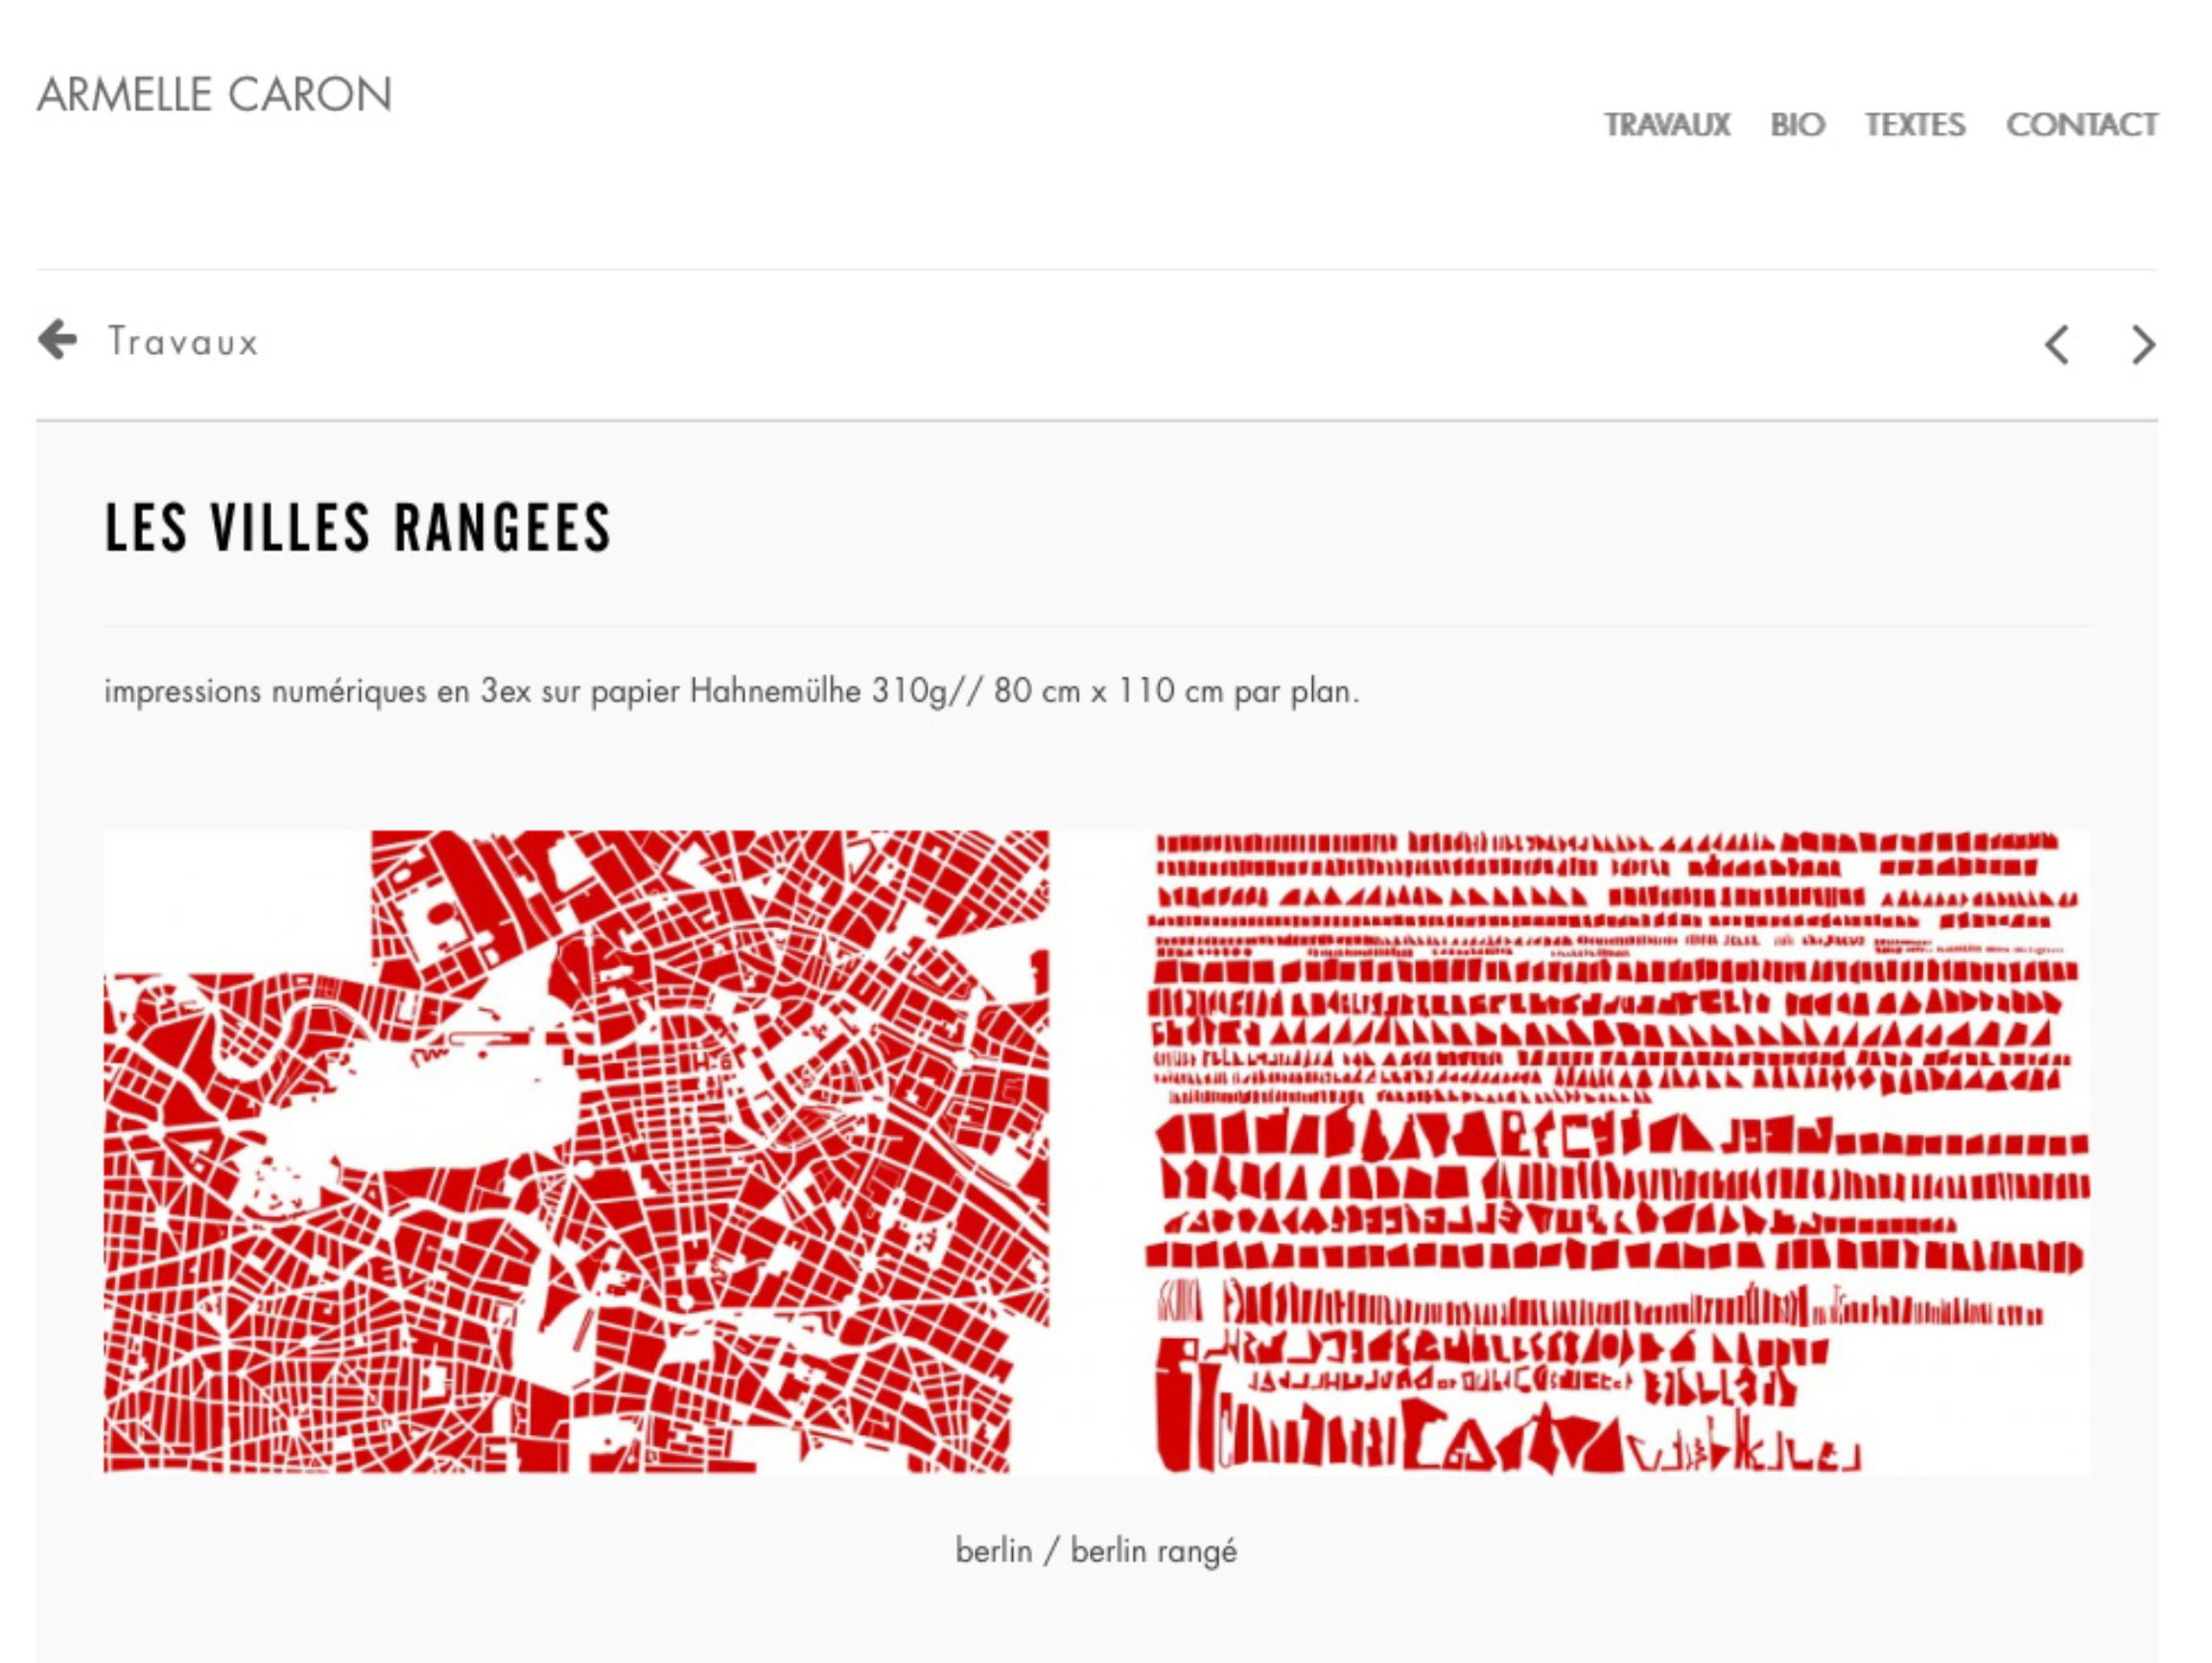
I wondered if I could automatically "destruct" and lay out the sections in a similar way. So began a side-project I've been working on, off-and-on, for 7 years. The original Github project gives a bit more detailed history, but the major iterations were:
Speculaas: April 2018
- 😞 screenshotted static 'maps'
- 😀 animated and interactive
- 😀 bin-packing auto-layout
Garibaldi: August 2019
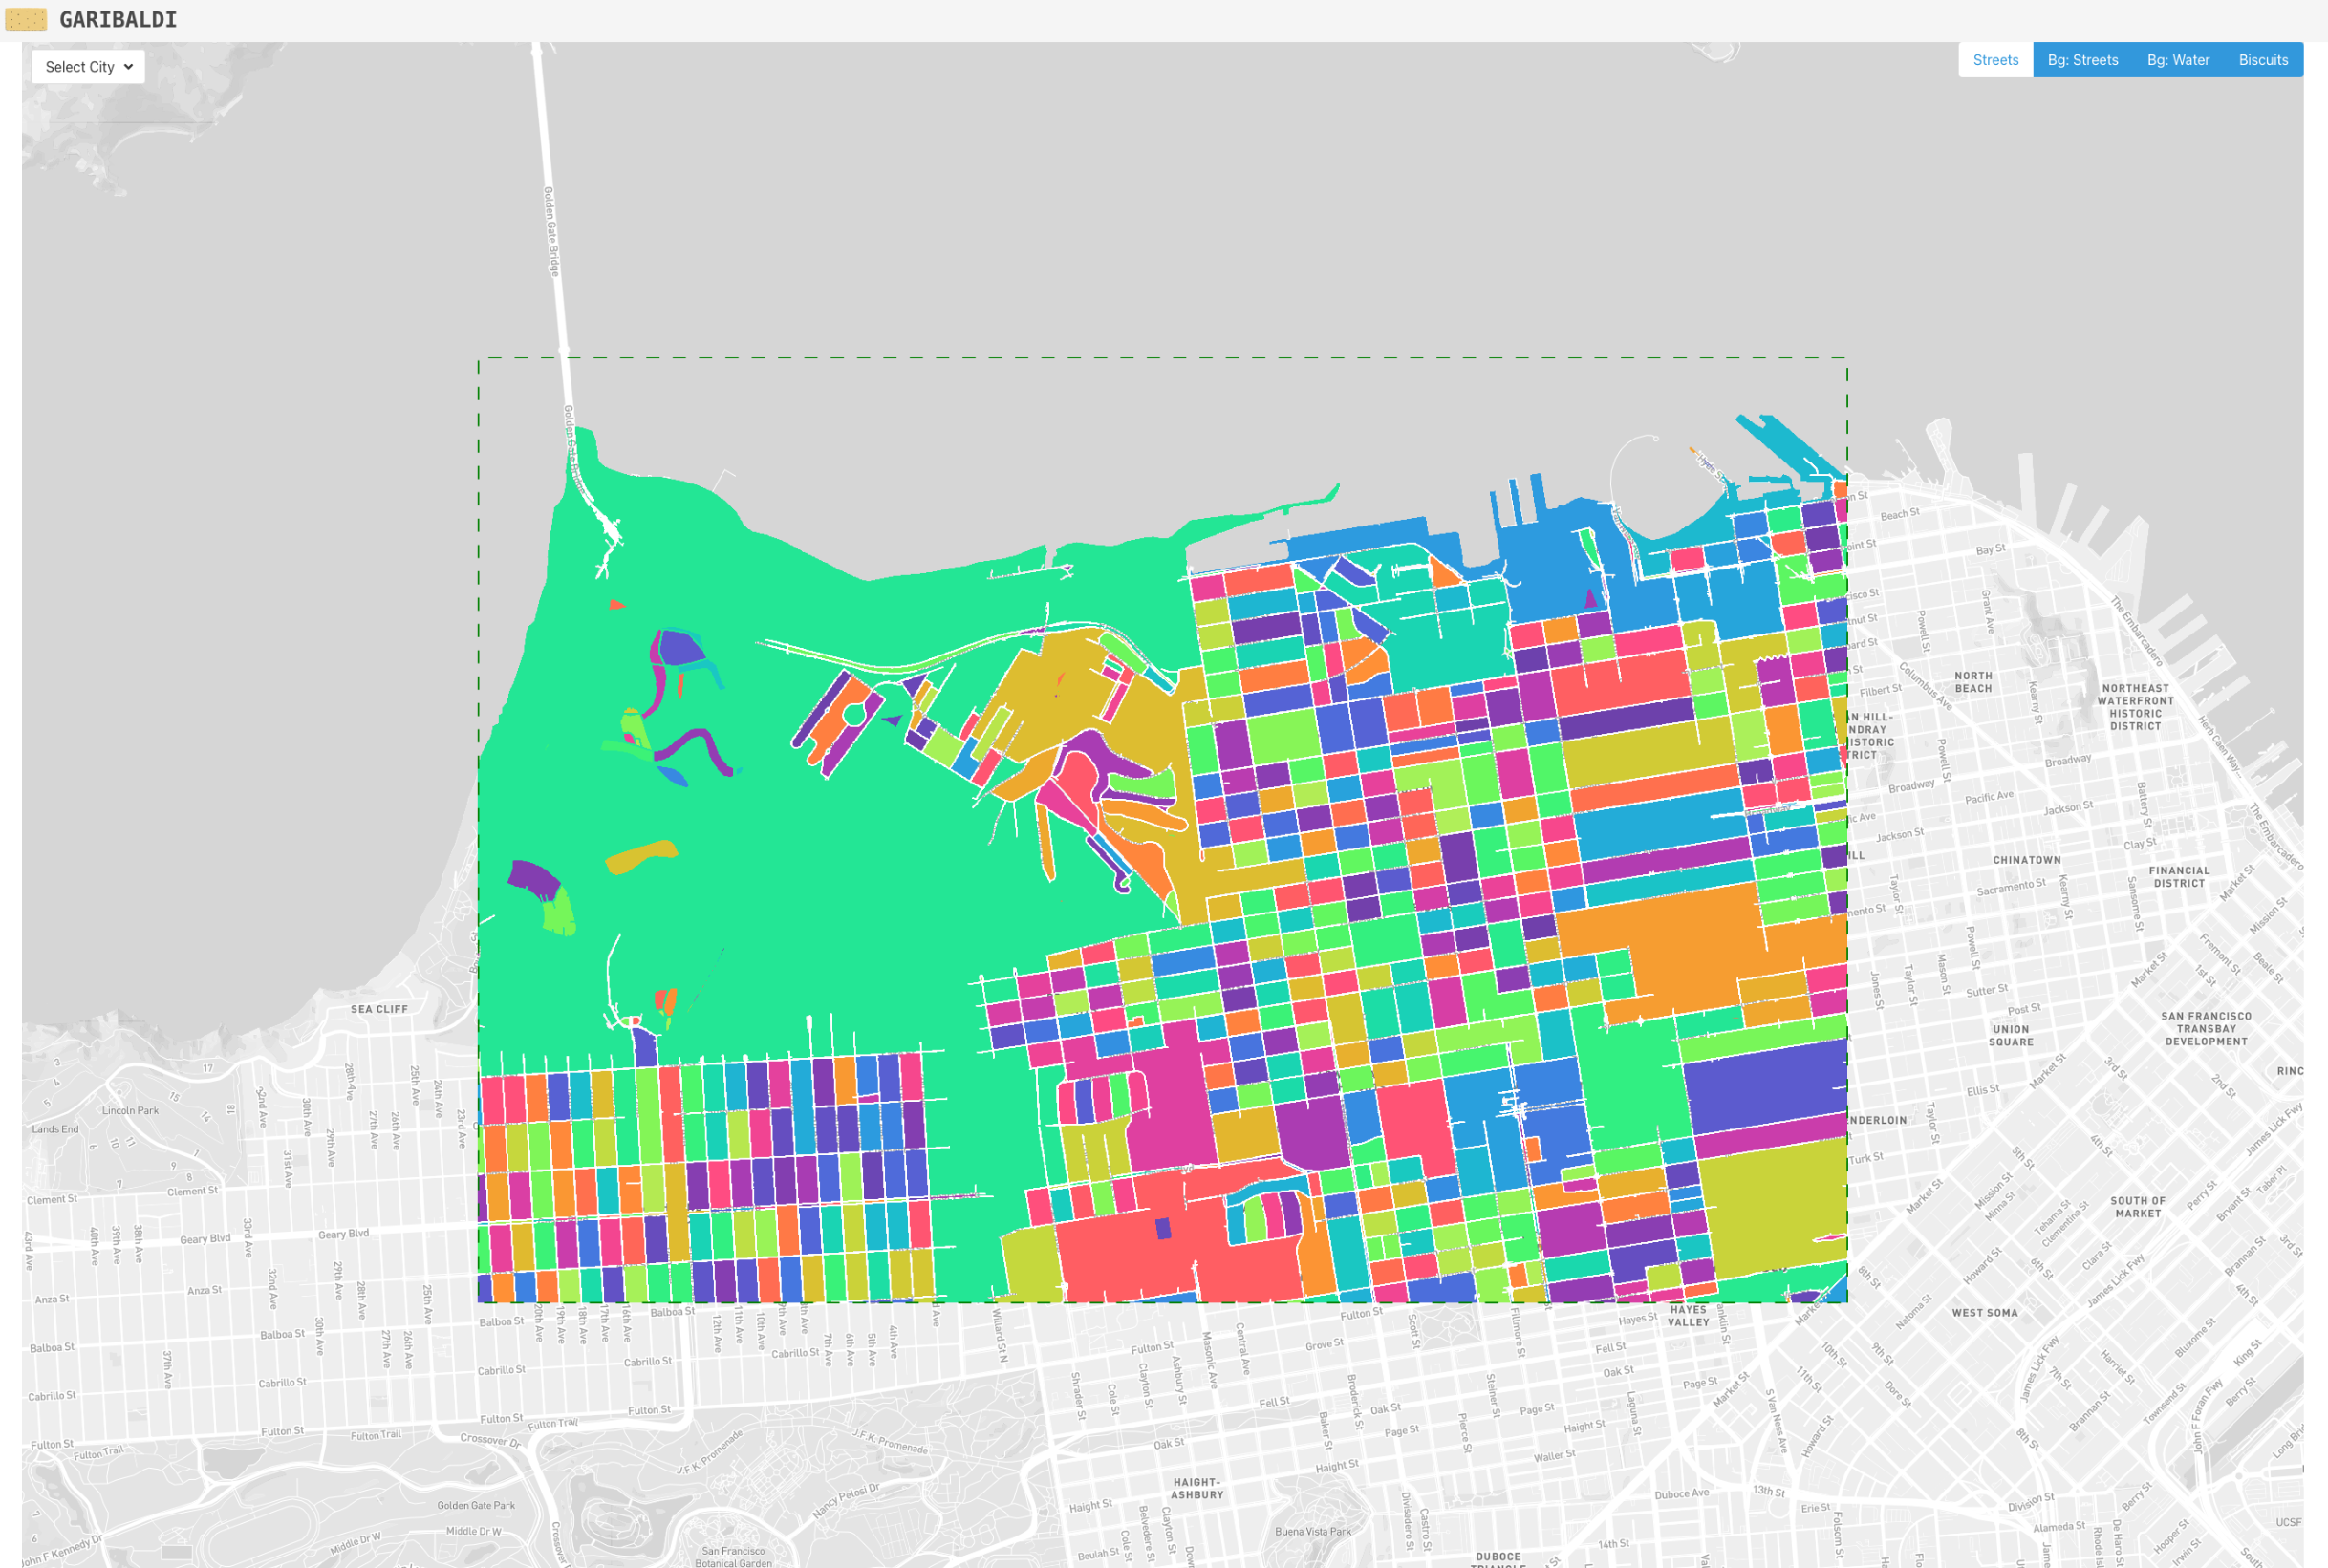
- 😀 dynamic maps
- 😀 interactive (runs in browser)
- 😭 pixel-based region-building affected by resolution quirks
Obviously we then had COVID happen in 2020, which was distracting to say the least. However, the biggest issue was that I discovered doing things entirely in the browser at pixel level was not very robust. There were various techniques I could have applied, like a separate off-screen canvas for calculations. That would require a lot of testing to get right and make work.
It felt though that this was going against-the-grain and, more generally, I was really just reluctant to go learn about how OpenstreetMap and Geo API's / libraries work.
Between then and now that's effectively what I've done, or at least enough to recreate where I got to in Speculaas, albeit entirely off-line.
The current version, which I got ready for the GeoMOB presentation, is pretty simple at the high-level:
    flowchart LR
    b(Boundaries) --> r(Regions) --> l(Layout)
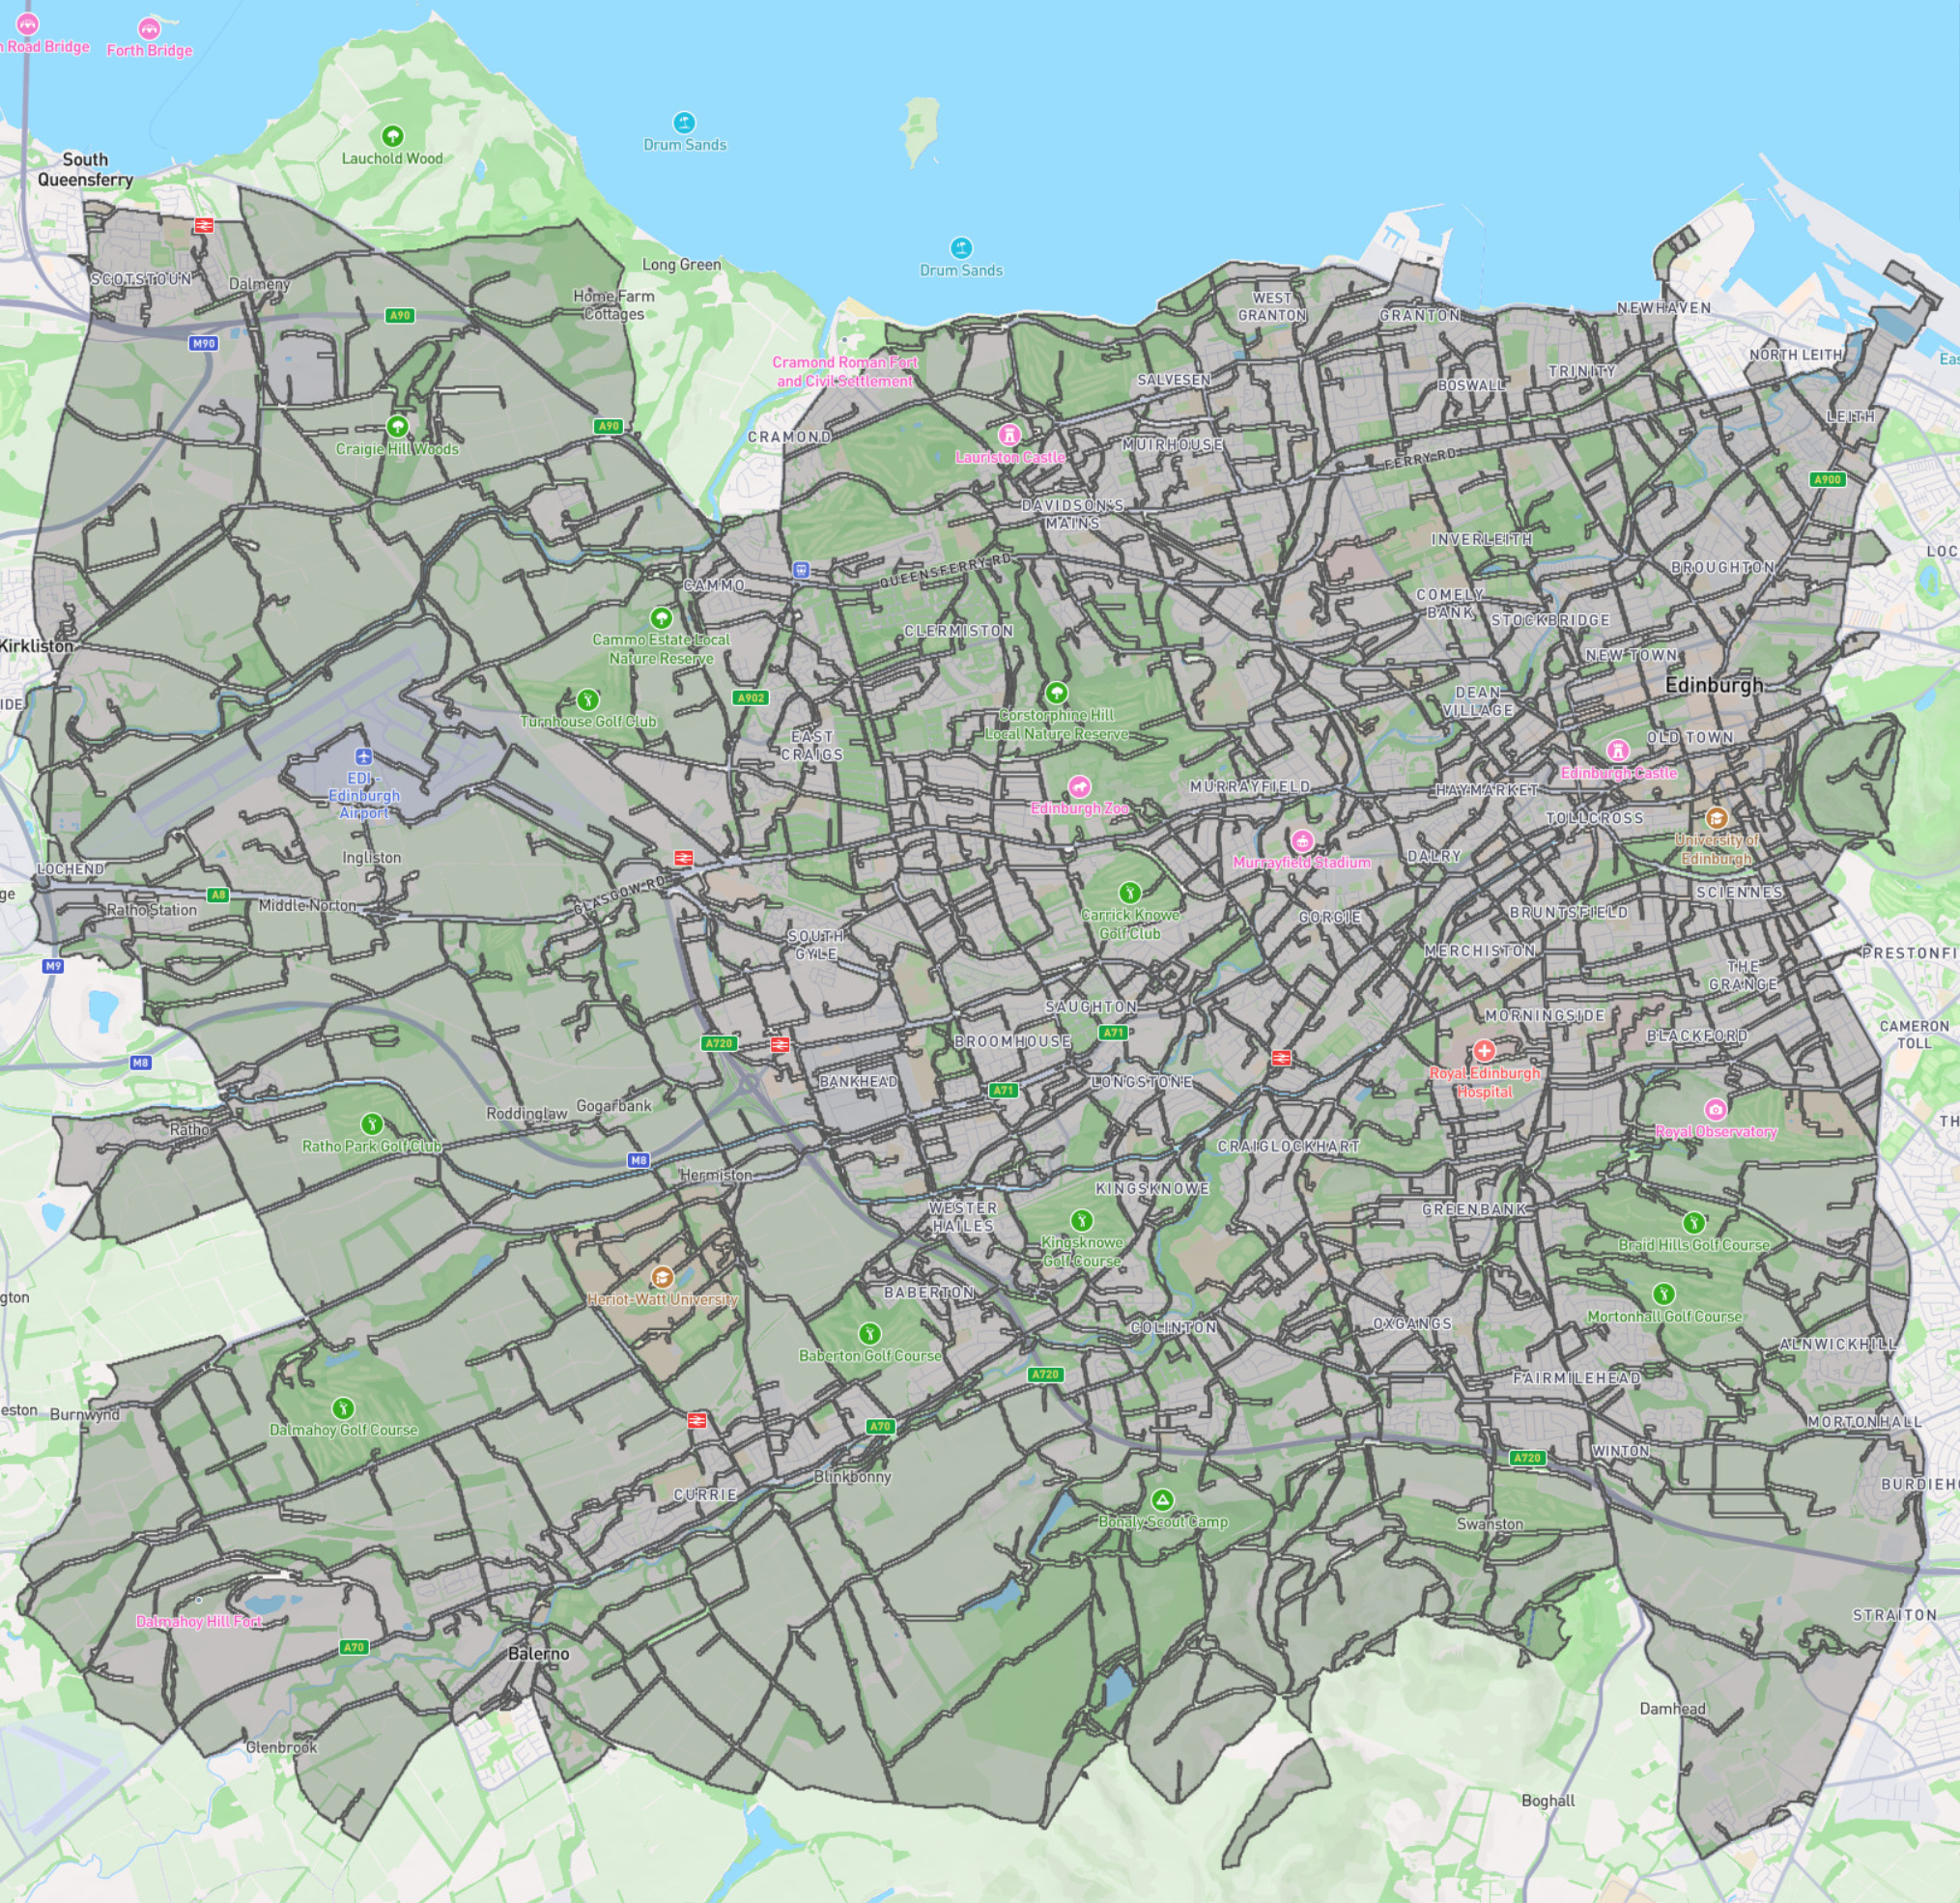
Boundaries
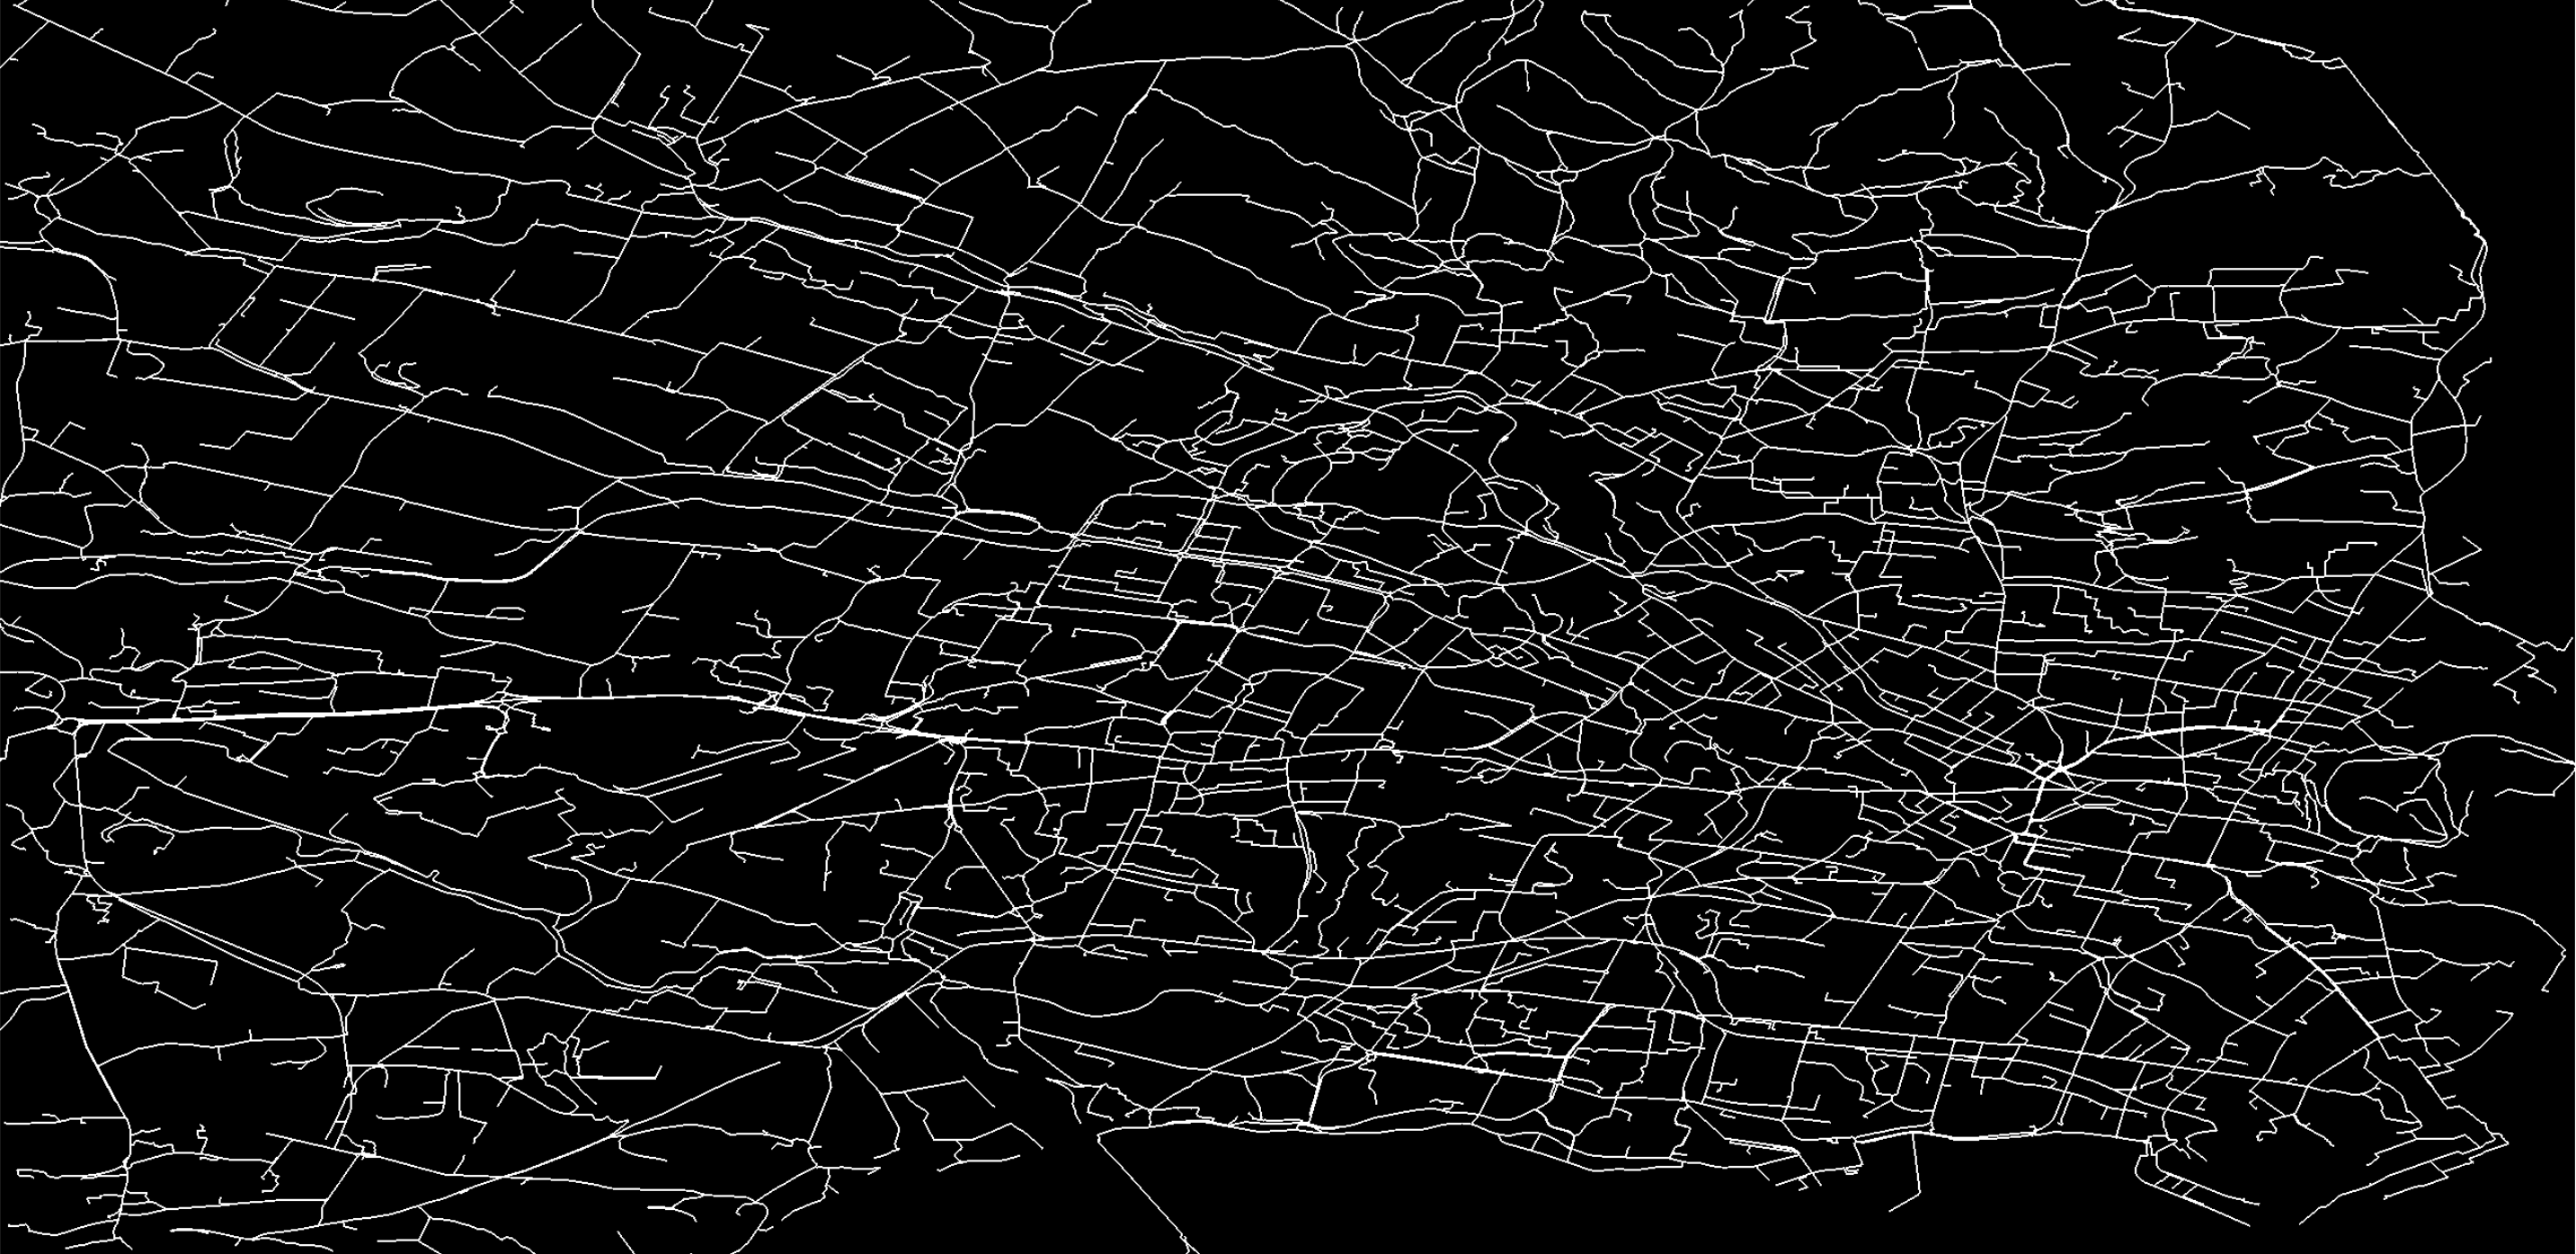
I'll not go into detail here but this image was derived by sampling and overlapping routes across Edinburgh from Stadia Maps.
Find Regions
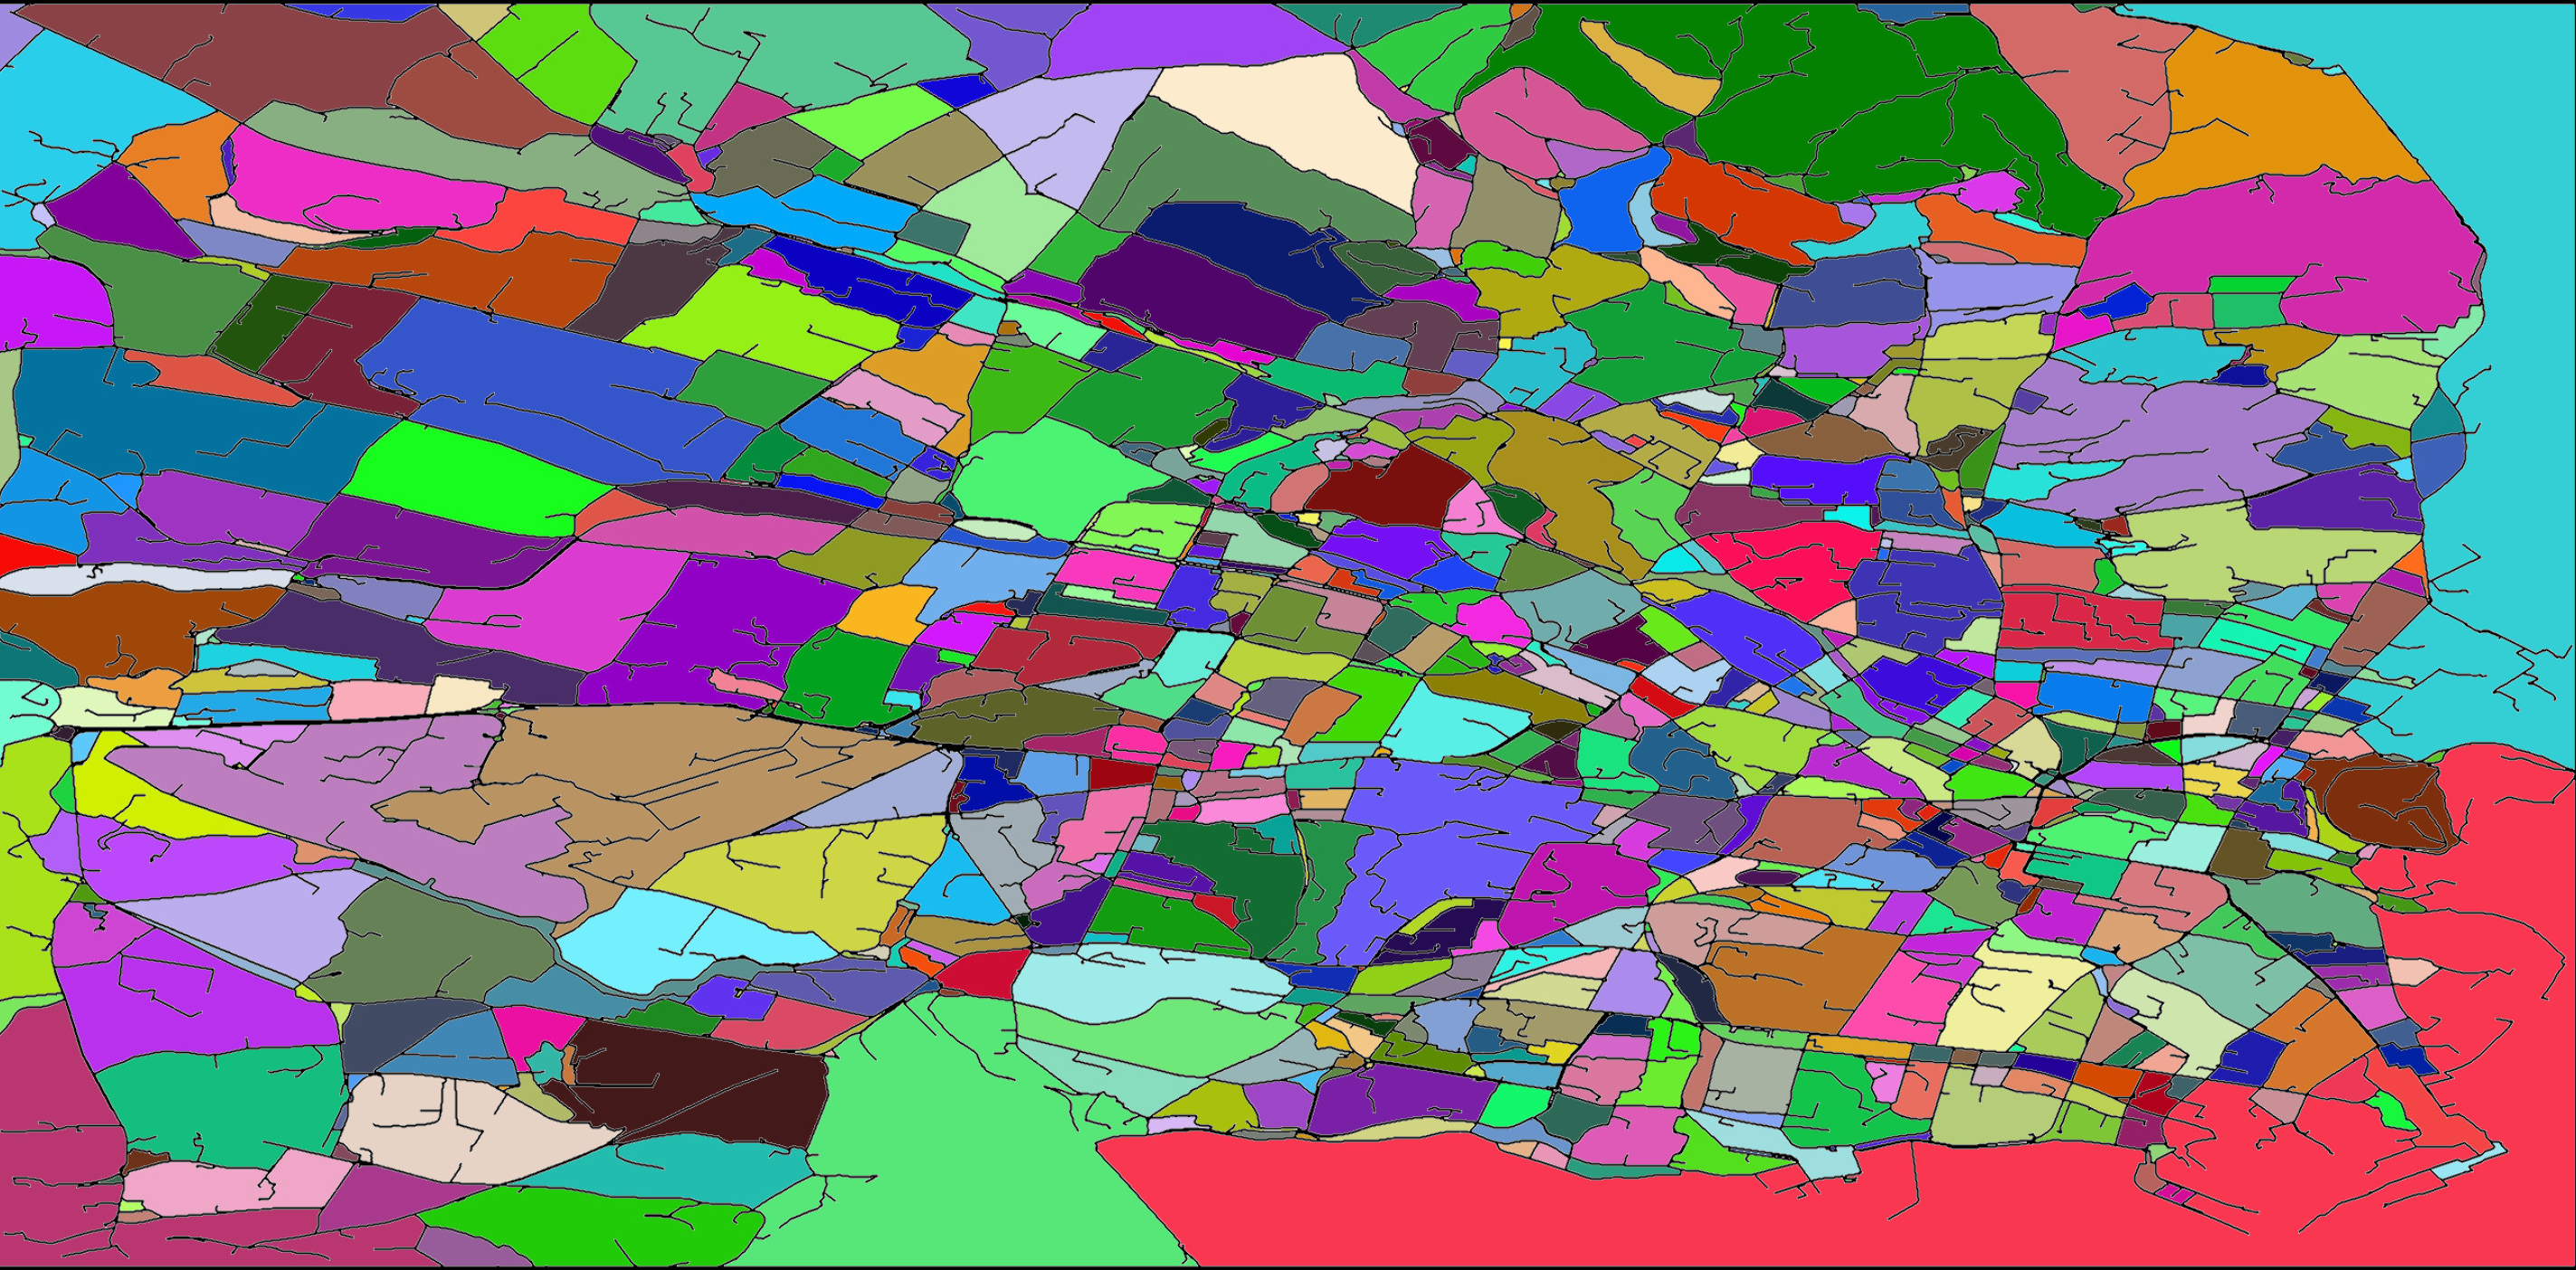
The actual Regions are found by applying a Boundary Tracing algorithm at the pixel level.
Back to Geo-land
Polygons.
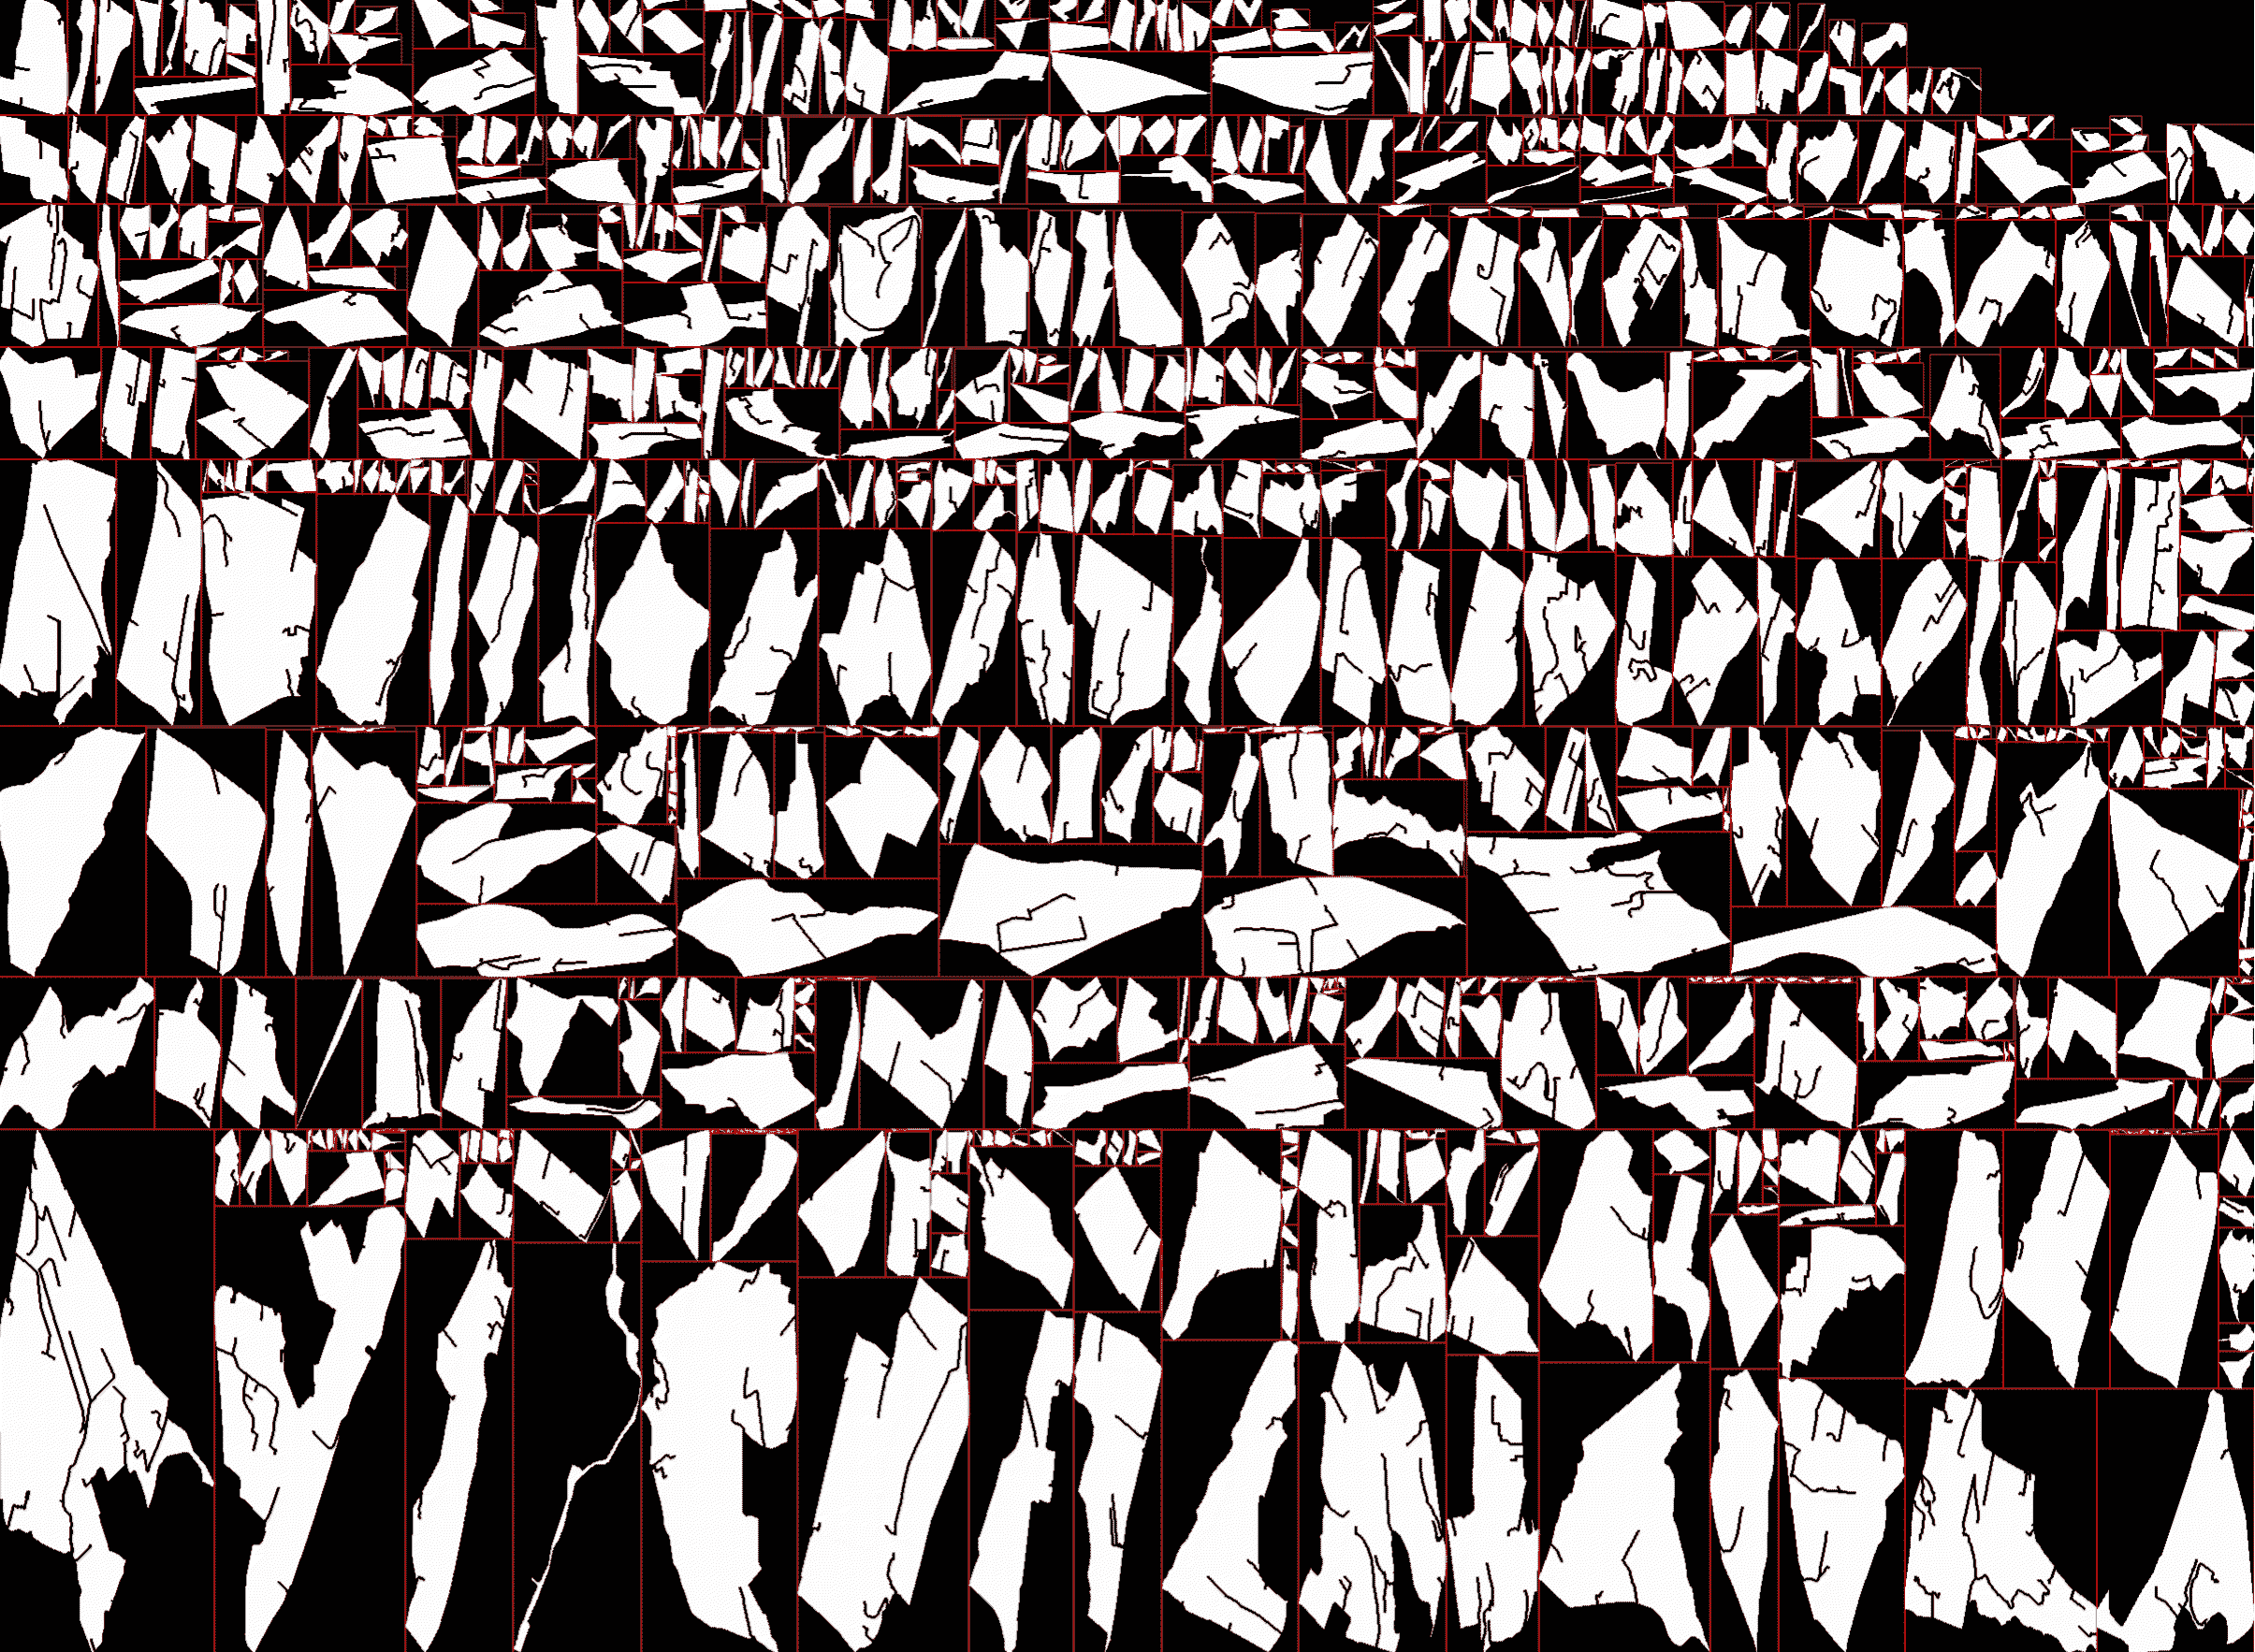
Layout
There are lots of different ways layout could be done. For this iteration, as in Speculaas, I treat this as 2d bin-packing problem.
This particular example here shows a layout based on a Guillotine algorithm.
What's next? Well, first a scorecard on this implementation, which I've christened "Linzer":
- 😀 pedestrian and auto-biased route sources
- 😀 deterministic
- 😀 bin-packing auto-layout
After this, there are a lot of things I could do next to improve it. Some of these I've done before in different iterations, and some are totally new:
- boundaries:
- roads, paths
- clip by city boundary
- mask-out water bodies
- regions:
- green areas
- rotate to minimal bbox
- layout:
- layout as text glyphs
- display:
- animated placement
However, since this is more of an Art Project than a technical one, I reserve the right to "honour my whimsy" and do something totally different.