Like before, this was another question that came up over the dinner-table when I was in Germany at xmas. I'd recently found out at a September Edinburgh GeoMob talk by Peter Creasey that Scotland had freely-available Lidar datasets. This sounded like a good opportunity to use them, particularly because I was wanting to play with datasets that provide height information.
The first hurdle at which so many of these "what if?" questions fall is access to data. So, a huge thanks to the Scottish Government for making these datasets available, and in an easily understood form!
I decided to interpret the question of "What happens to Edinburgh if sea-level rises?" as "Which parts of Edinburgh are above different heights?". The Lidar datasets contain a Digital Terrain Model which looked like what I needed as input, so my rough plan was:
- Find boundary of Edinburgh in OvertureMaps
- Find grid cells in Lidar data corresponding to this area
- Build an H3 grid over same area
- Map H3 grid over Lidar cells, extracting out the min heights that sit under it
- Visualise impact of changing sea-level
This interpretation and method for sure could be improved, but I find it is sometimes easier to do something concrete but imperfect, before improving it later or taking these learnings to subsequent projects.
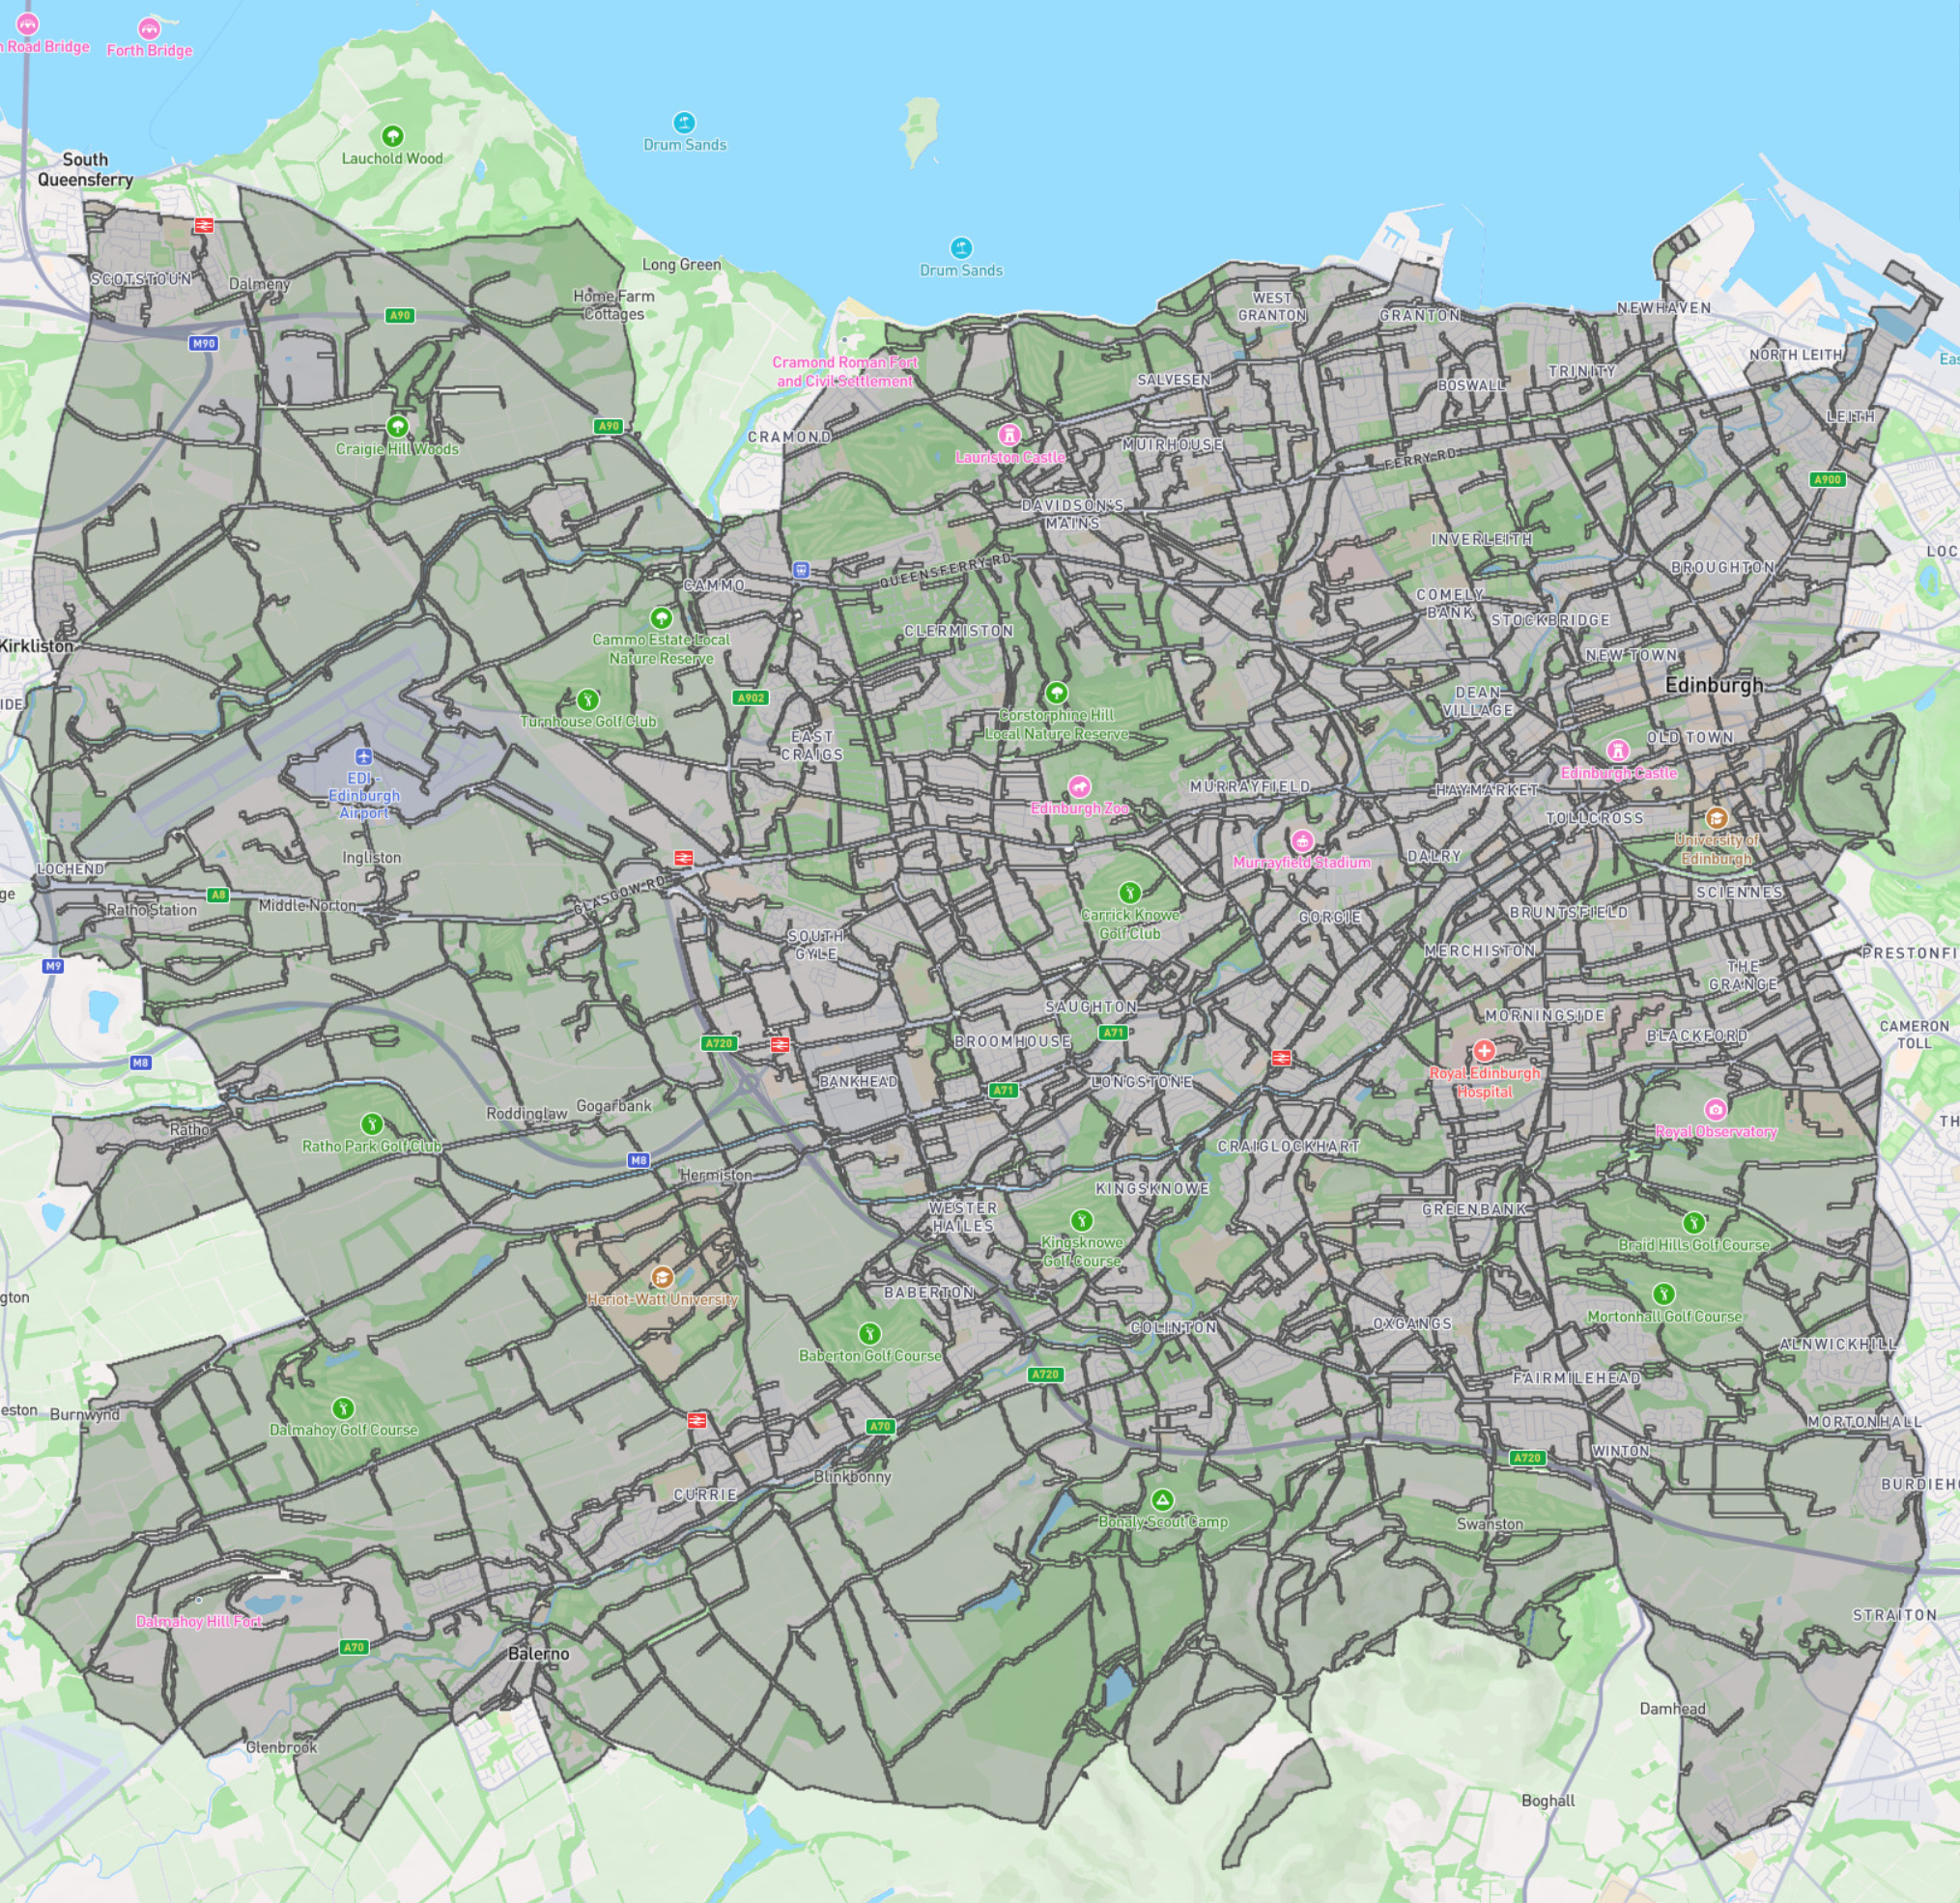
One of the first things I noticed after a first-pass through doing all of the above was that the Edinburgh boundary seemed to exclude pieces of the coast:
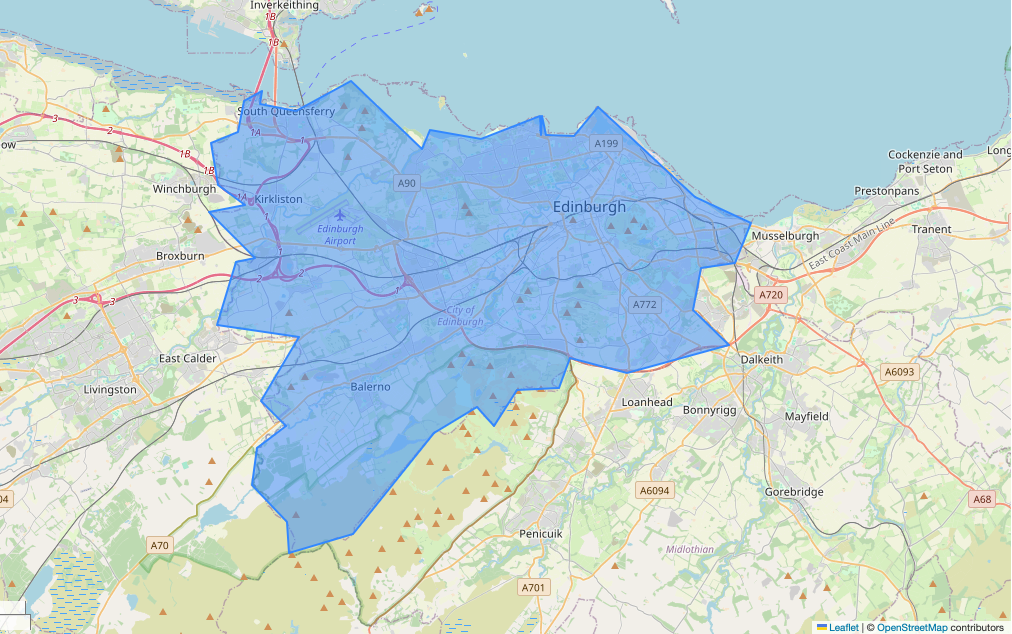
This is a good example of how different aspects of geo quality can affect what you are doing in a very case-specific way. With my other projects, where I've used this same boundary, I've been using it for things like constraining placement of random points, so it hasn't mattered too much. In this case I explicitly care about the boundary close to the water.
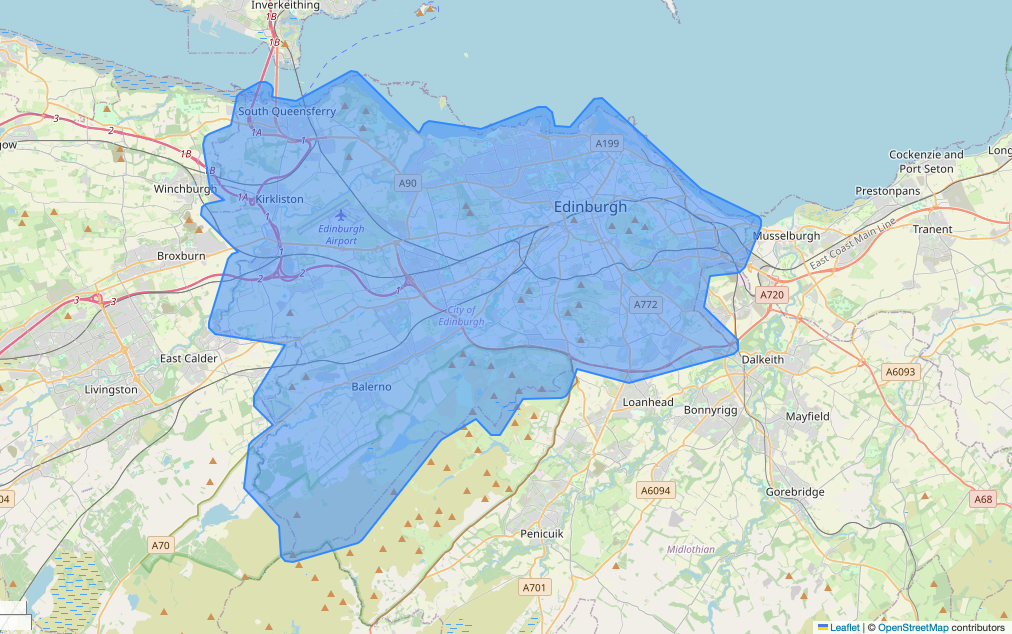
I decided to fudge it a little here by applying a buffer of 400 metres and manually inspecting it was sufficient to include my areas of interest. This isn't rigourous and wouldn't scale easily to other cities, but was good enough for this specific example.
Building and using the grids ended up being a lot of back-and-forth between Claude/Opus4.5 and myself, either separately or via the Marimo integration. Claude tended to produce a big wodge of Python attempting to solve the whole thing. Whilst I like Python, it's too easy for Claude, and myself, to make dumb mistakes. Add onto this that we're dealing with Geo, where you're only one bad projection away from making your result meaningless.
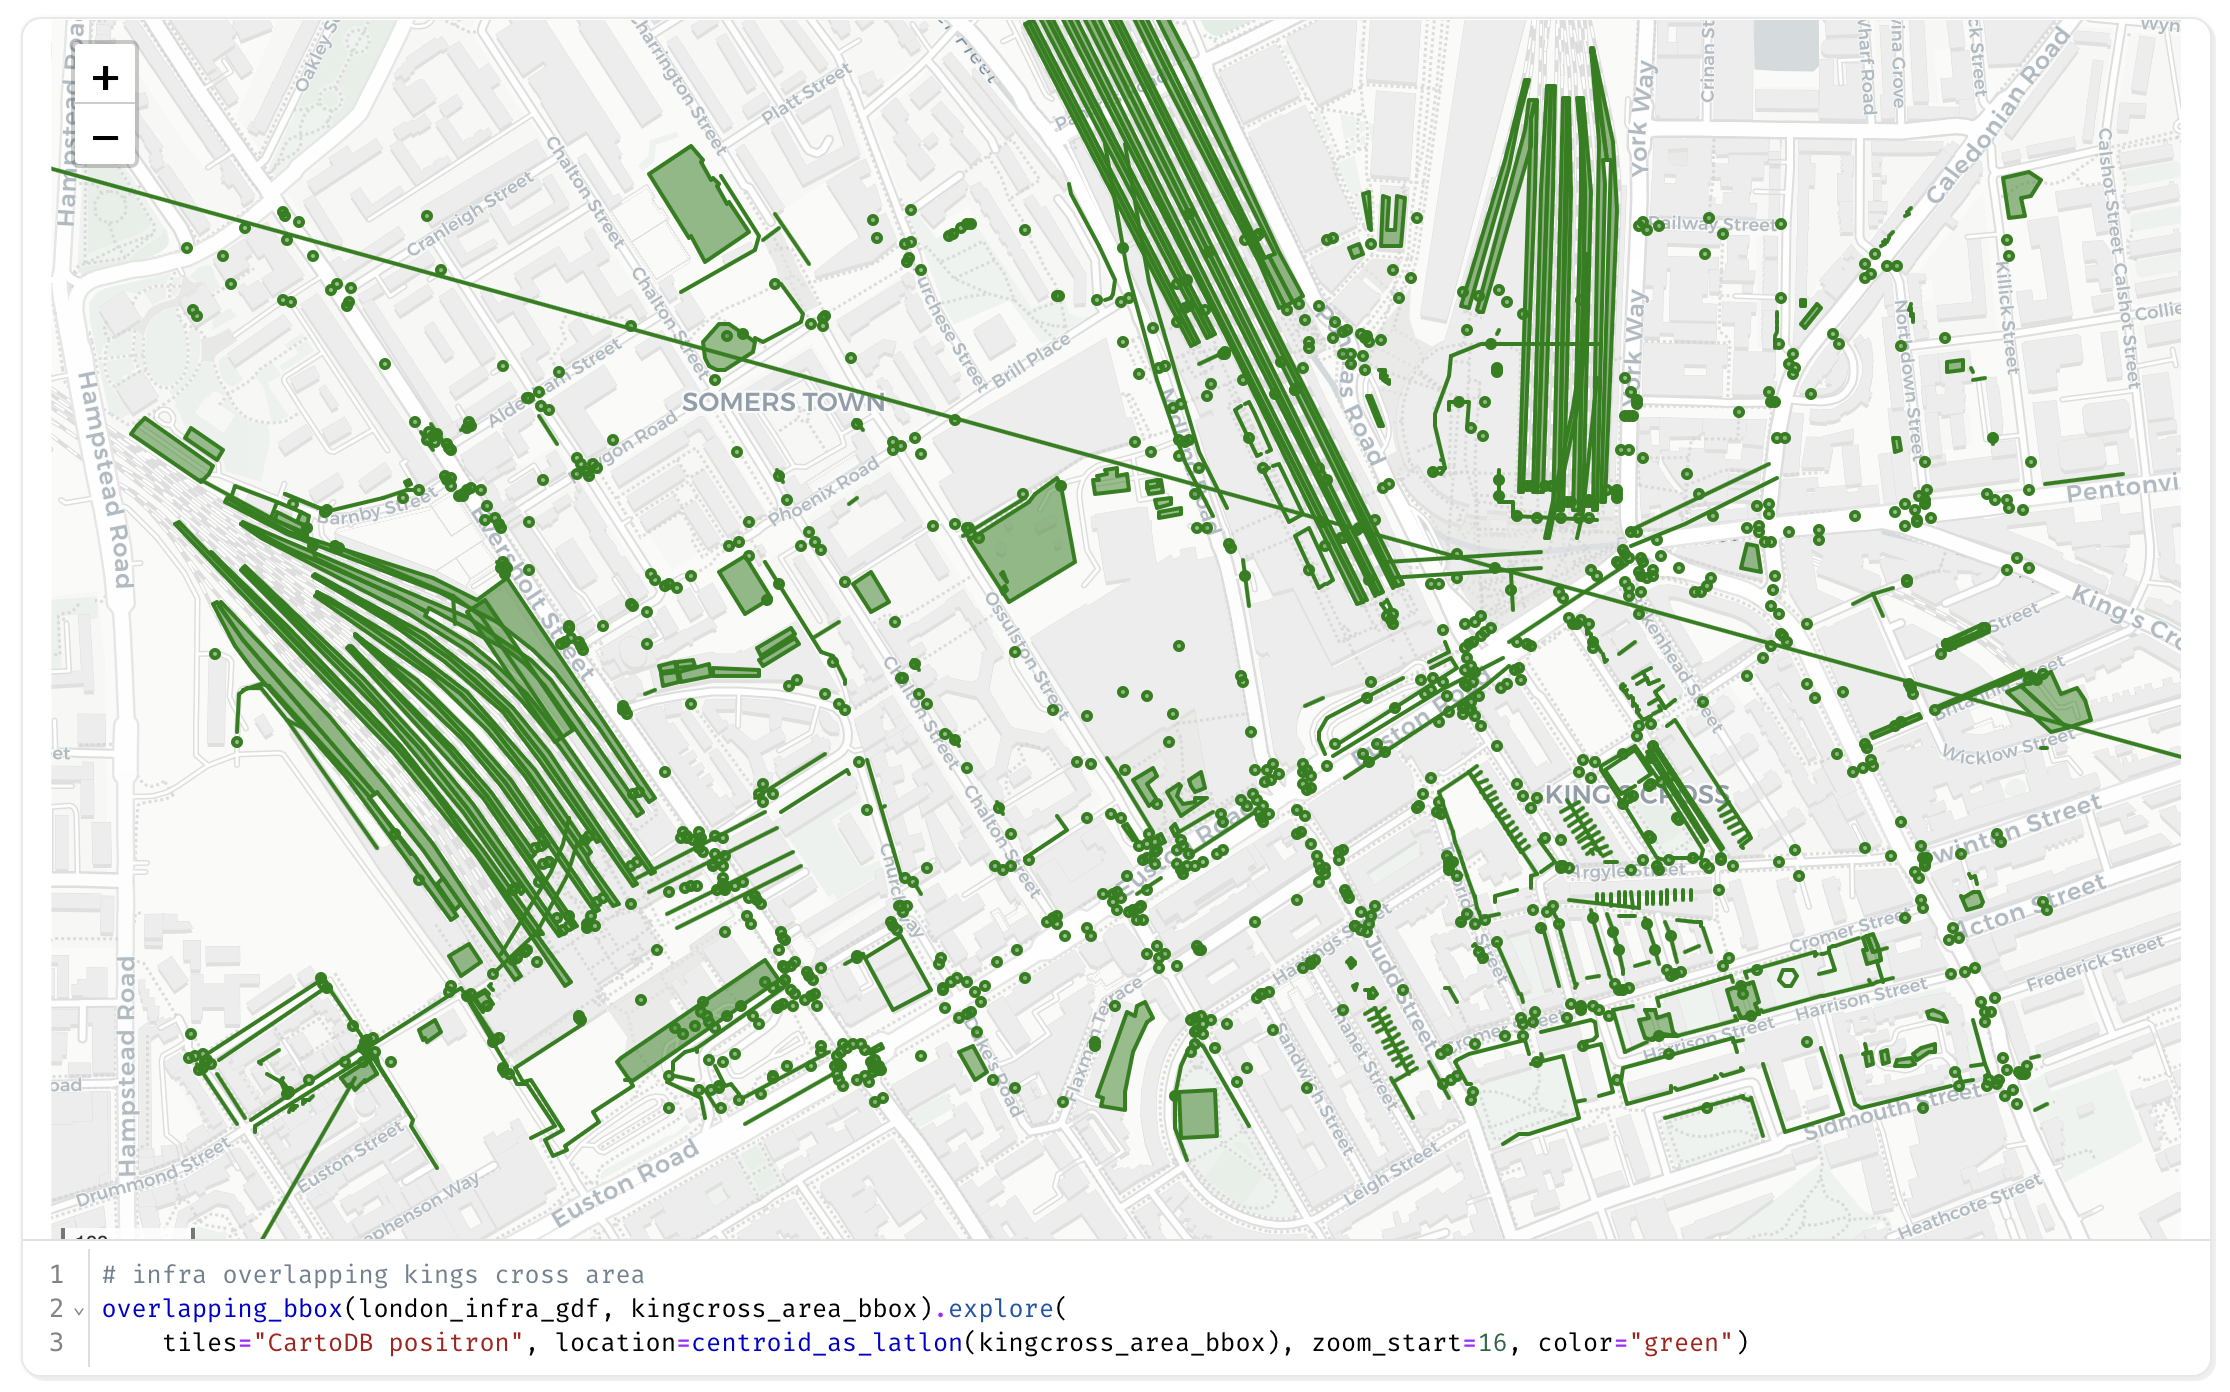
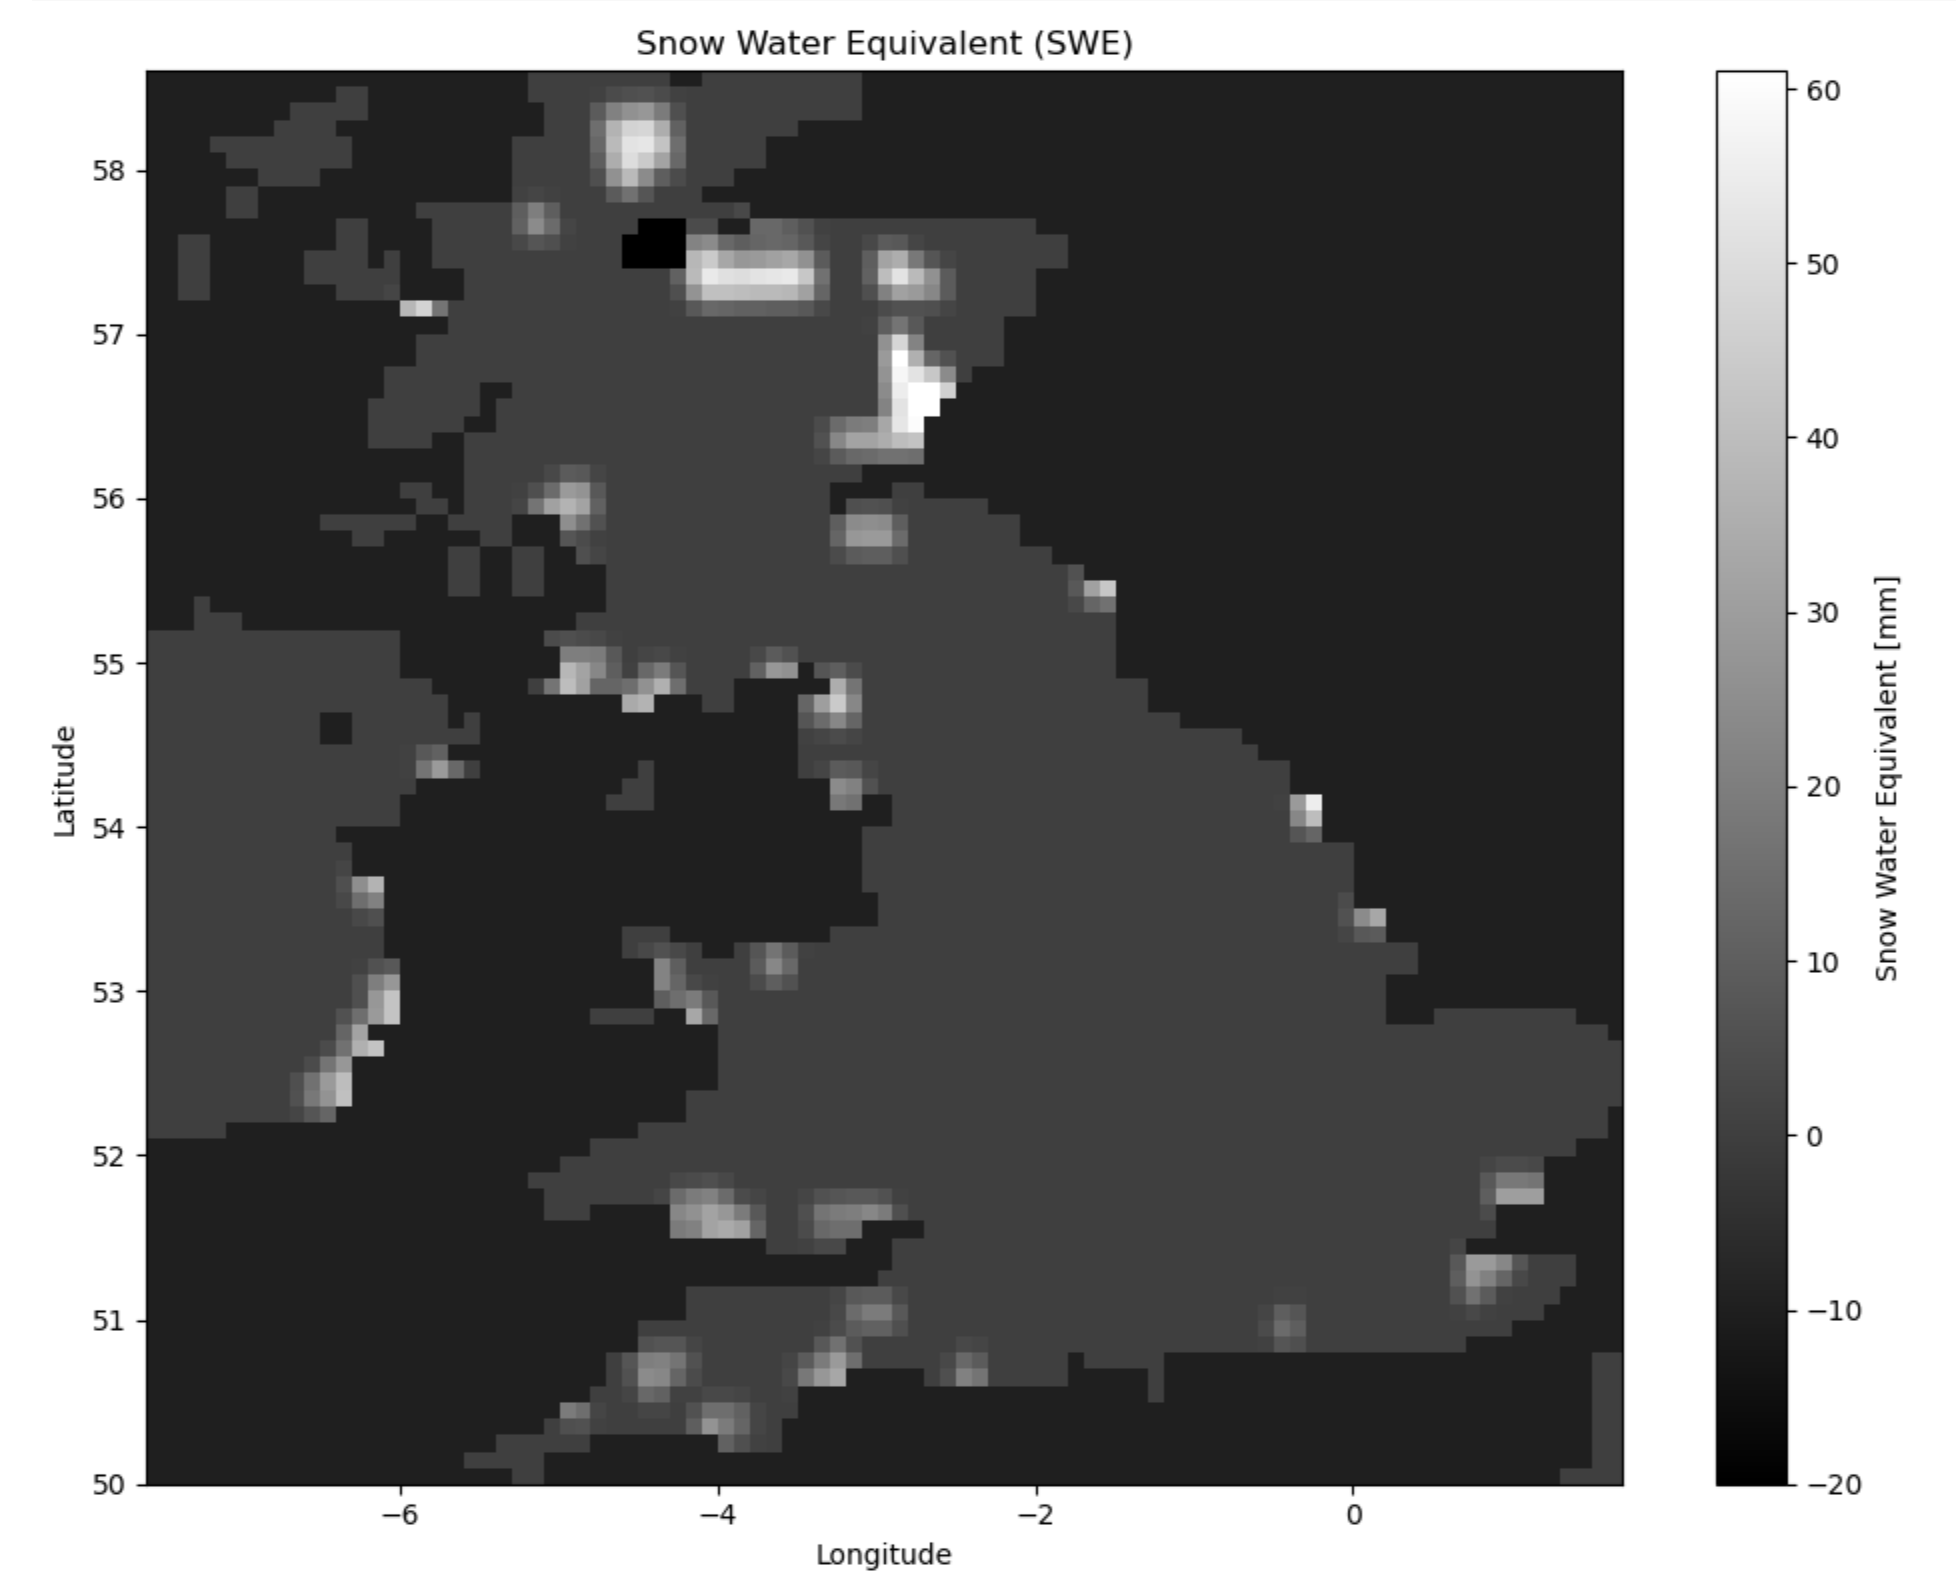
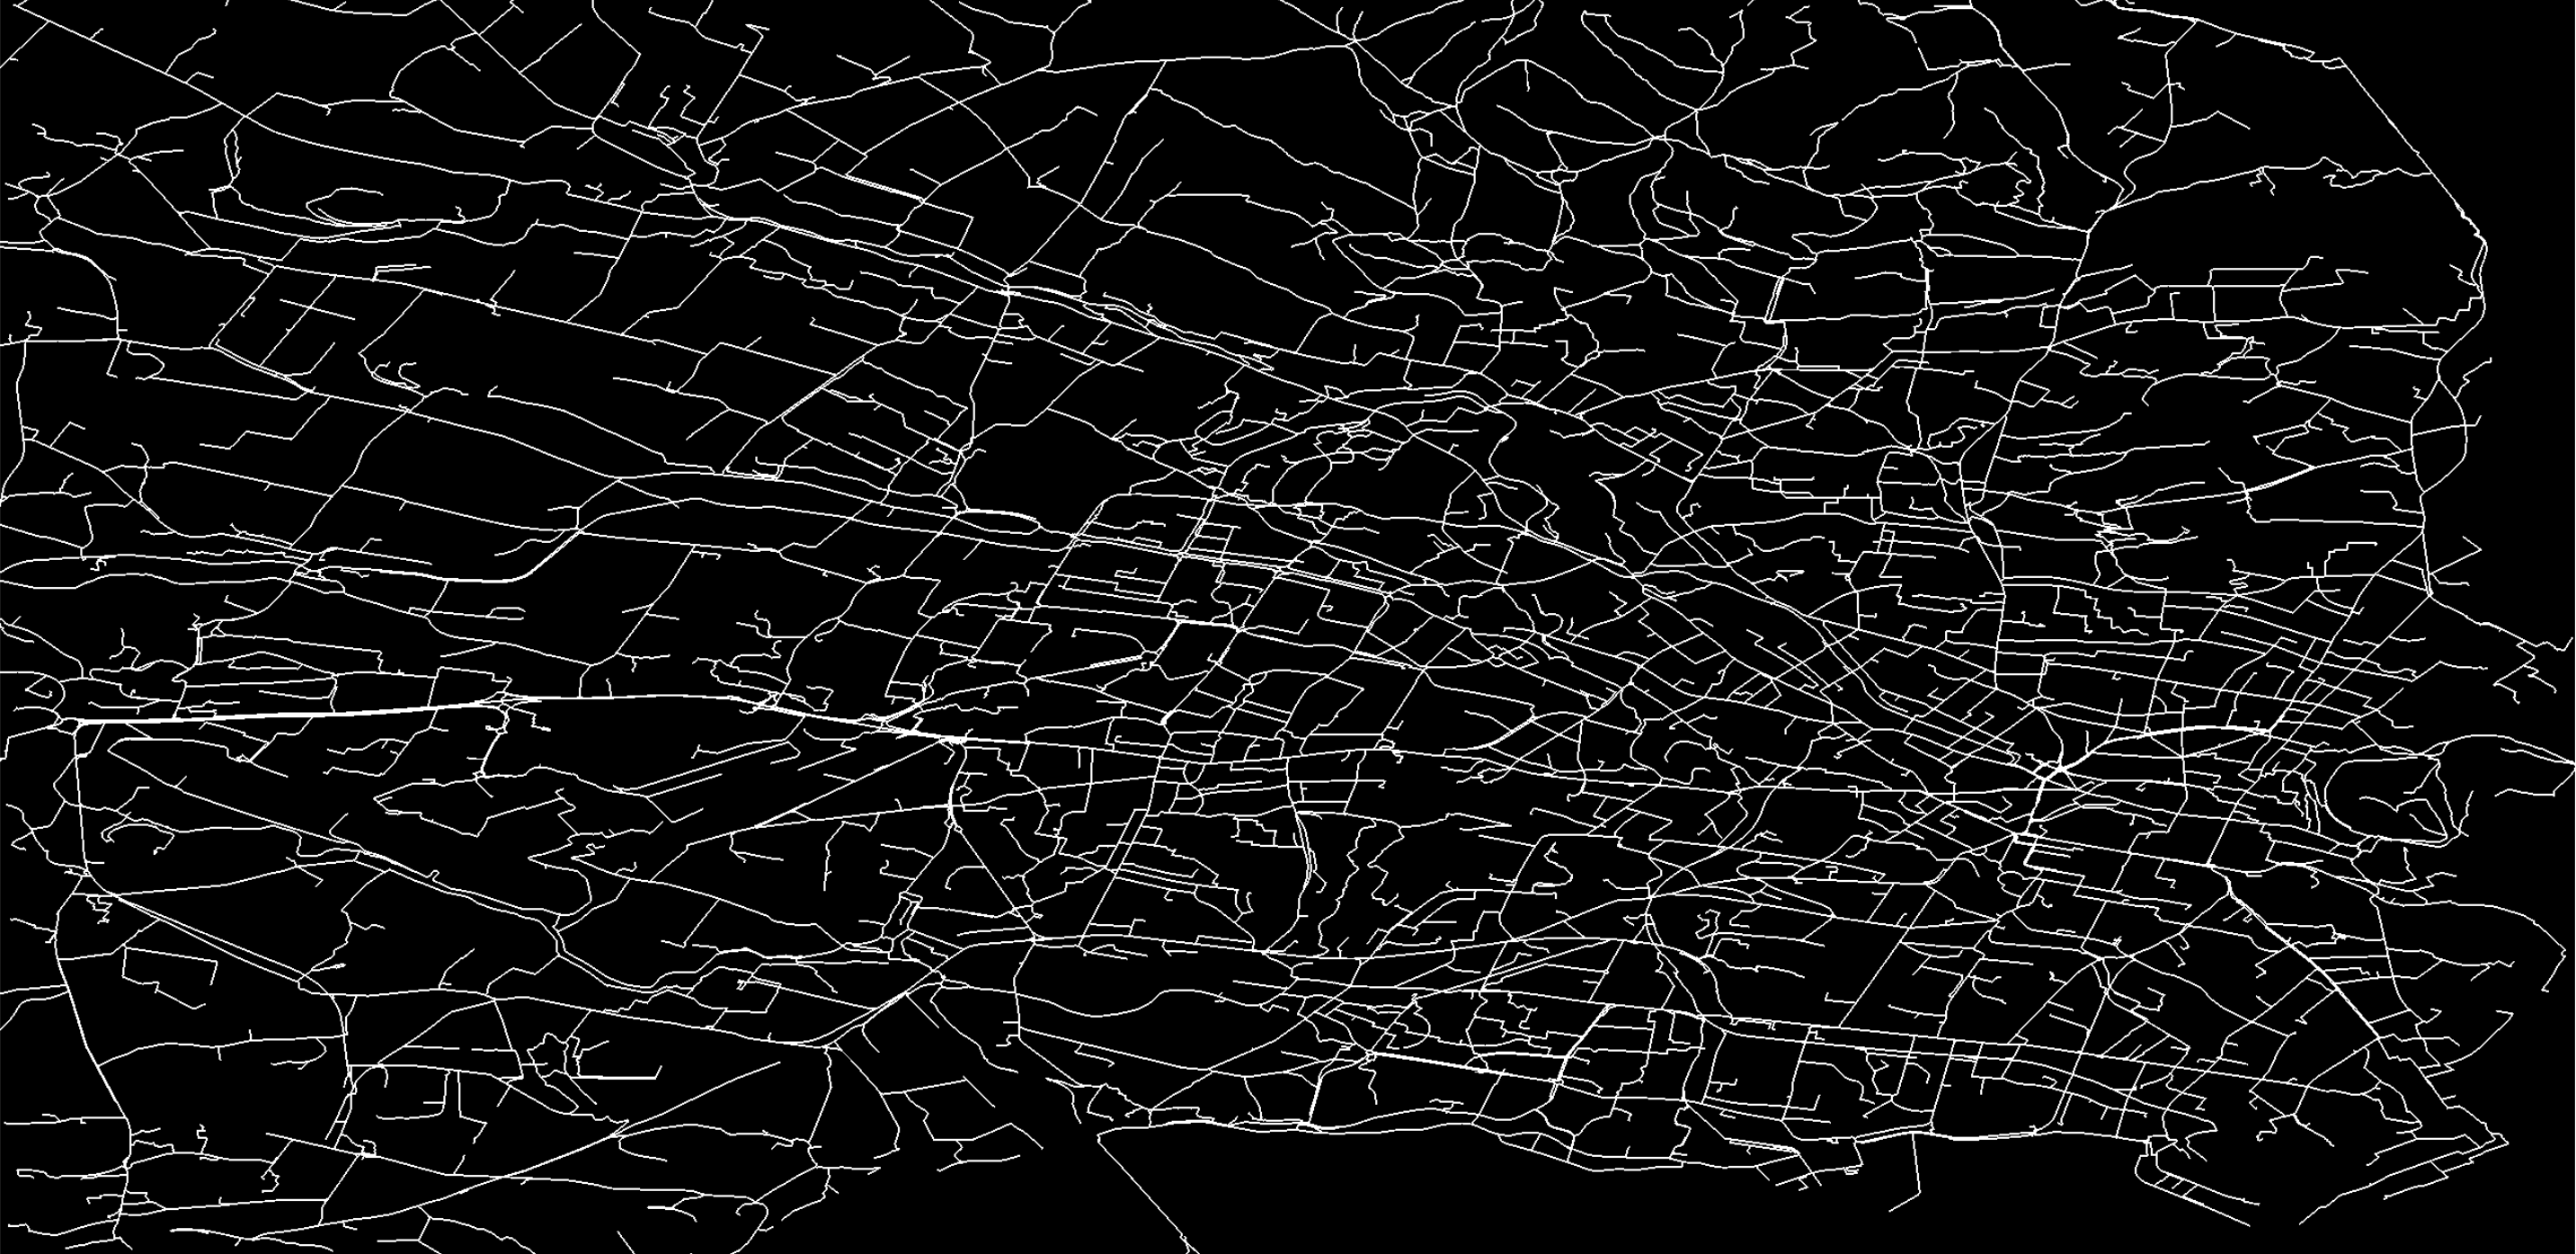
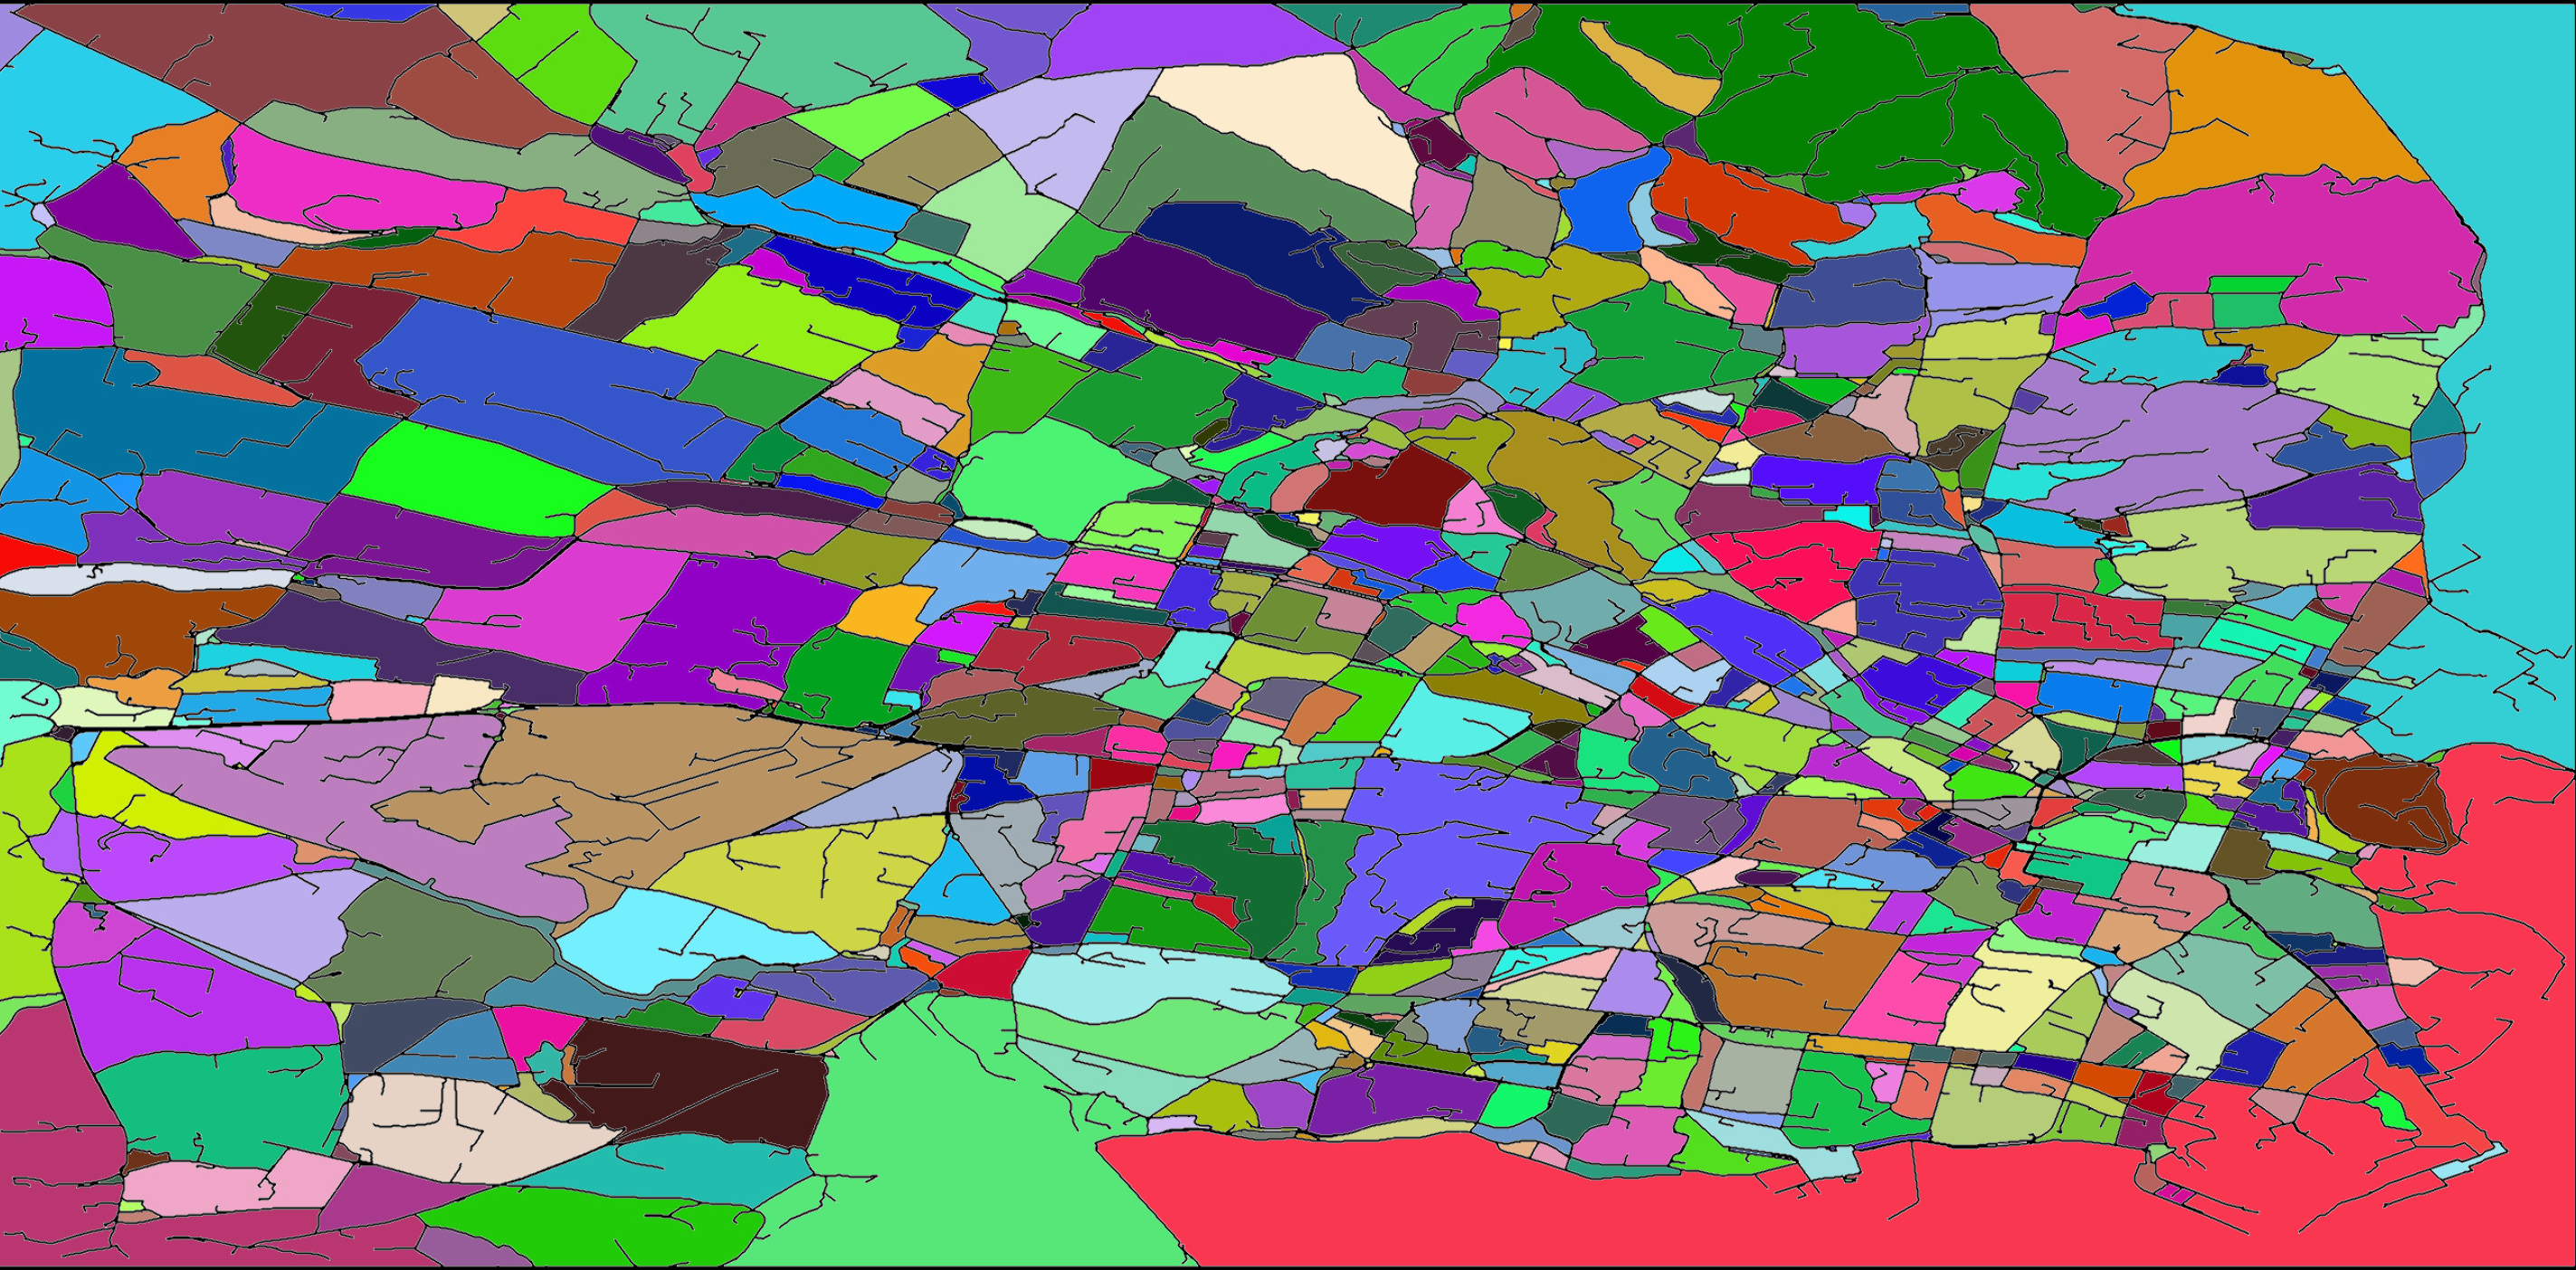
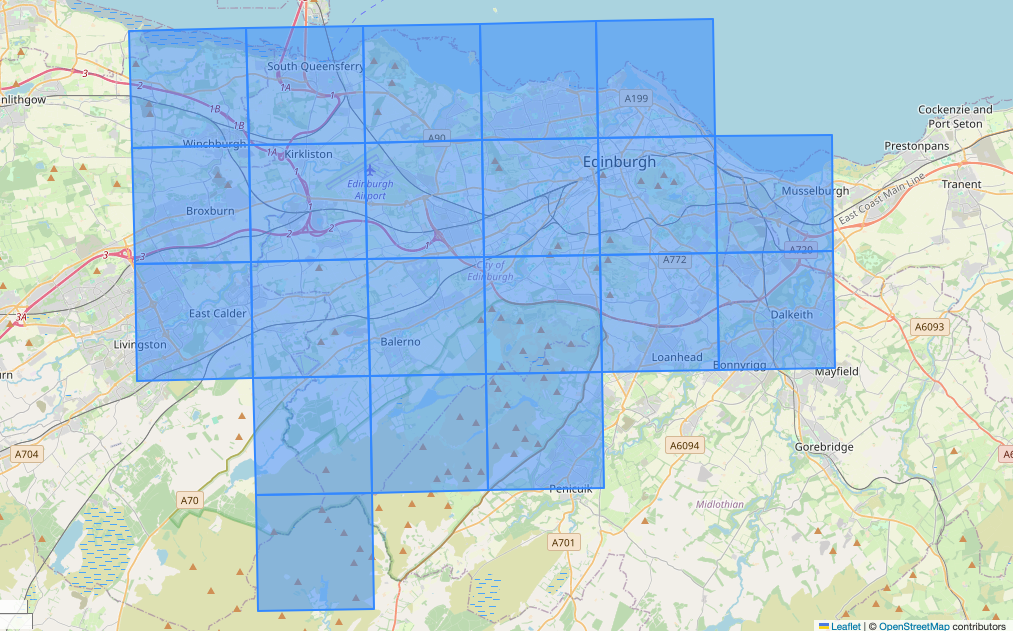
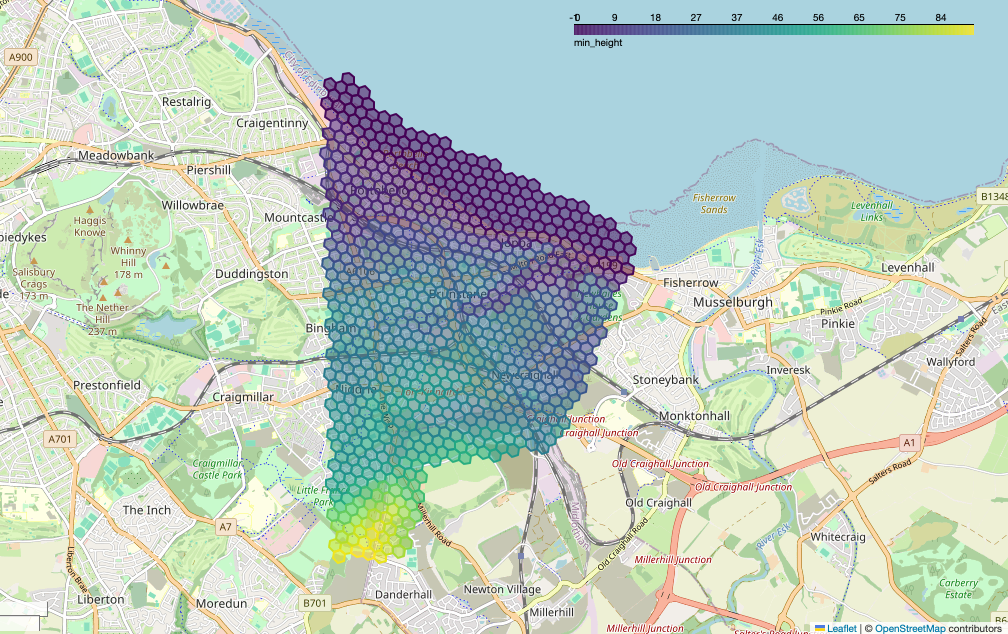
So, I used Claude's suggestions in a similar way as I do my own Geo explorations: splitting steps into smaller functions and chunks, and applying them incrementally in a notebook, inspecting the output as I go. For example, visualising the Lidar grid ...
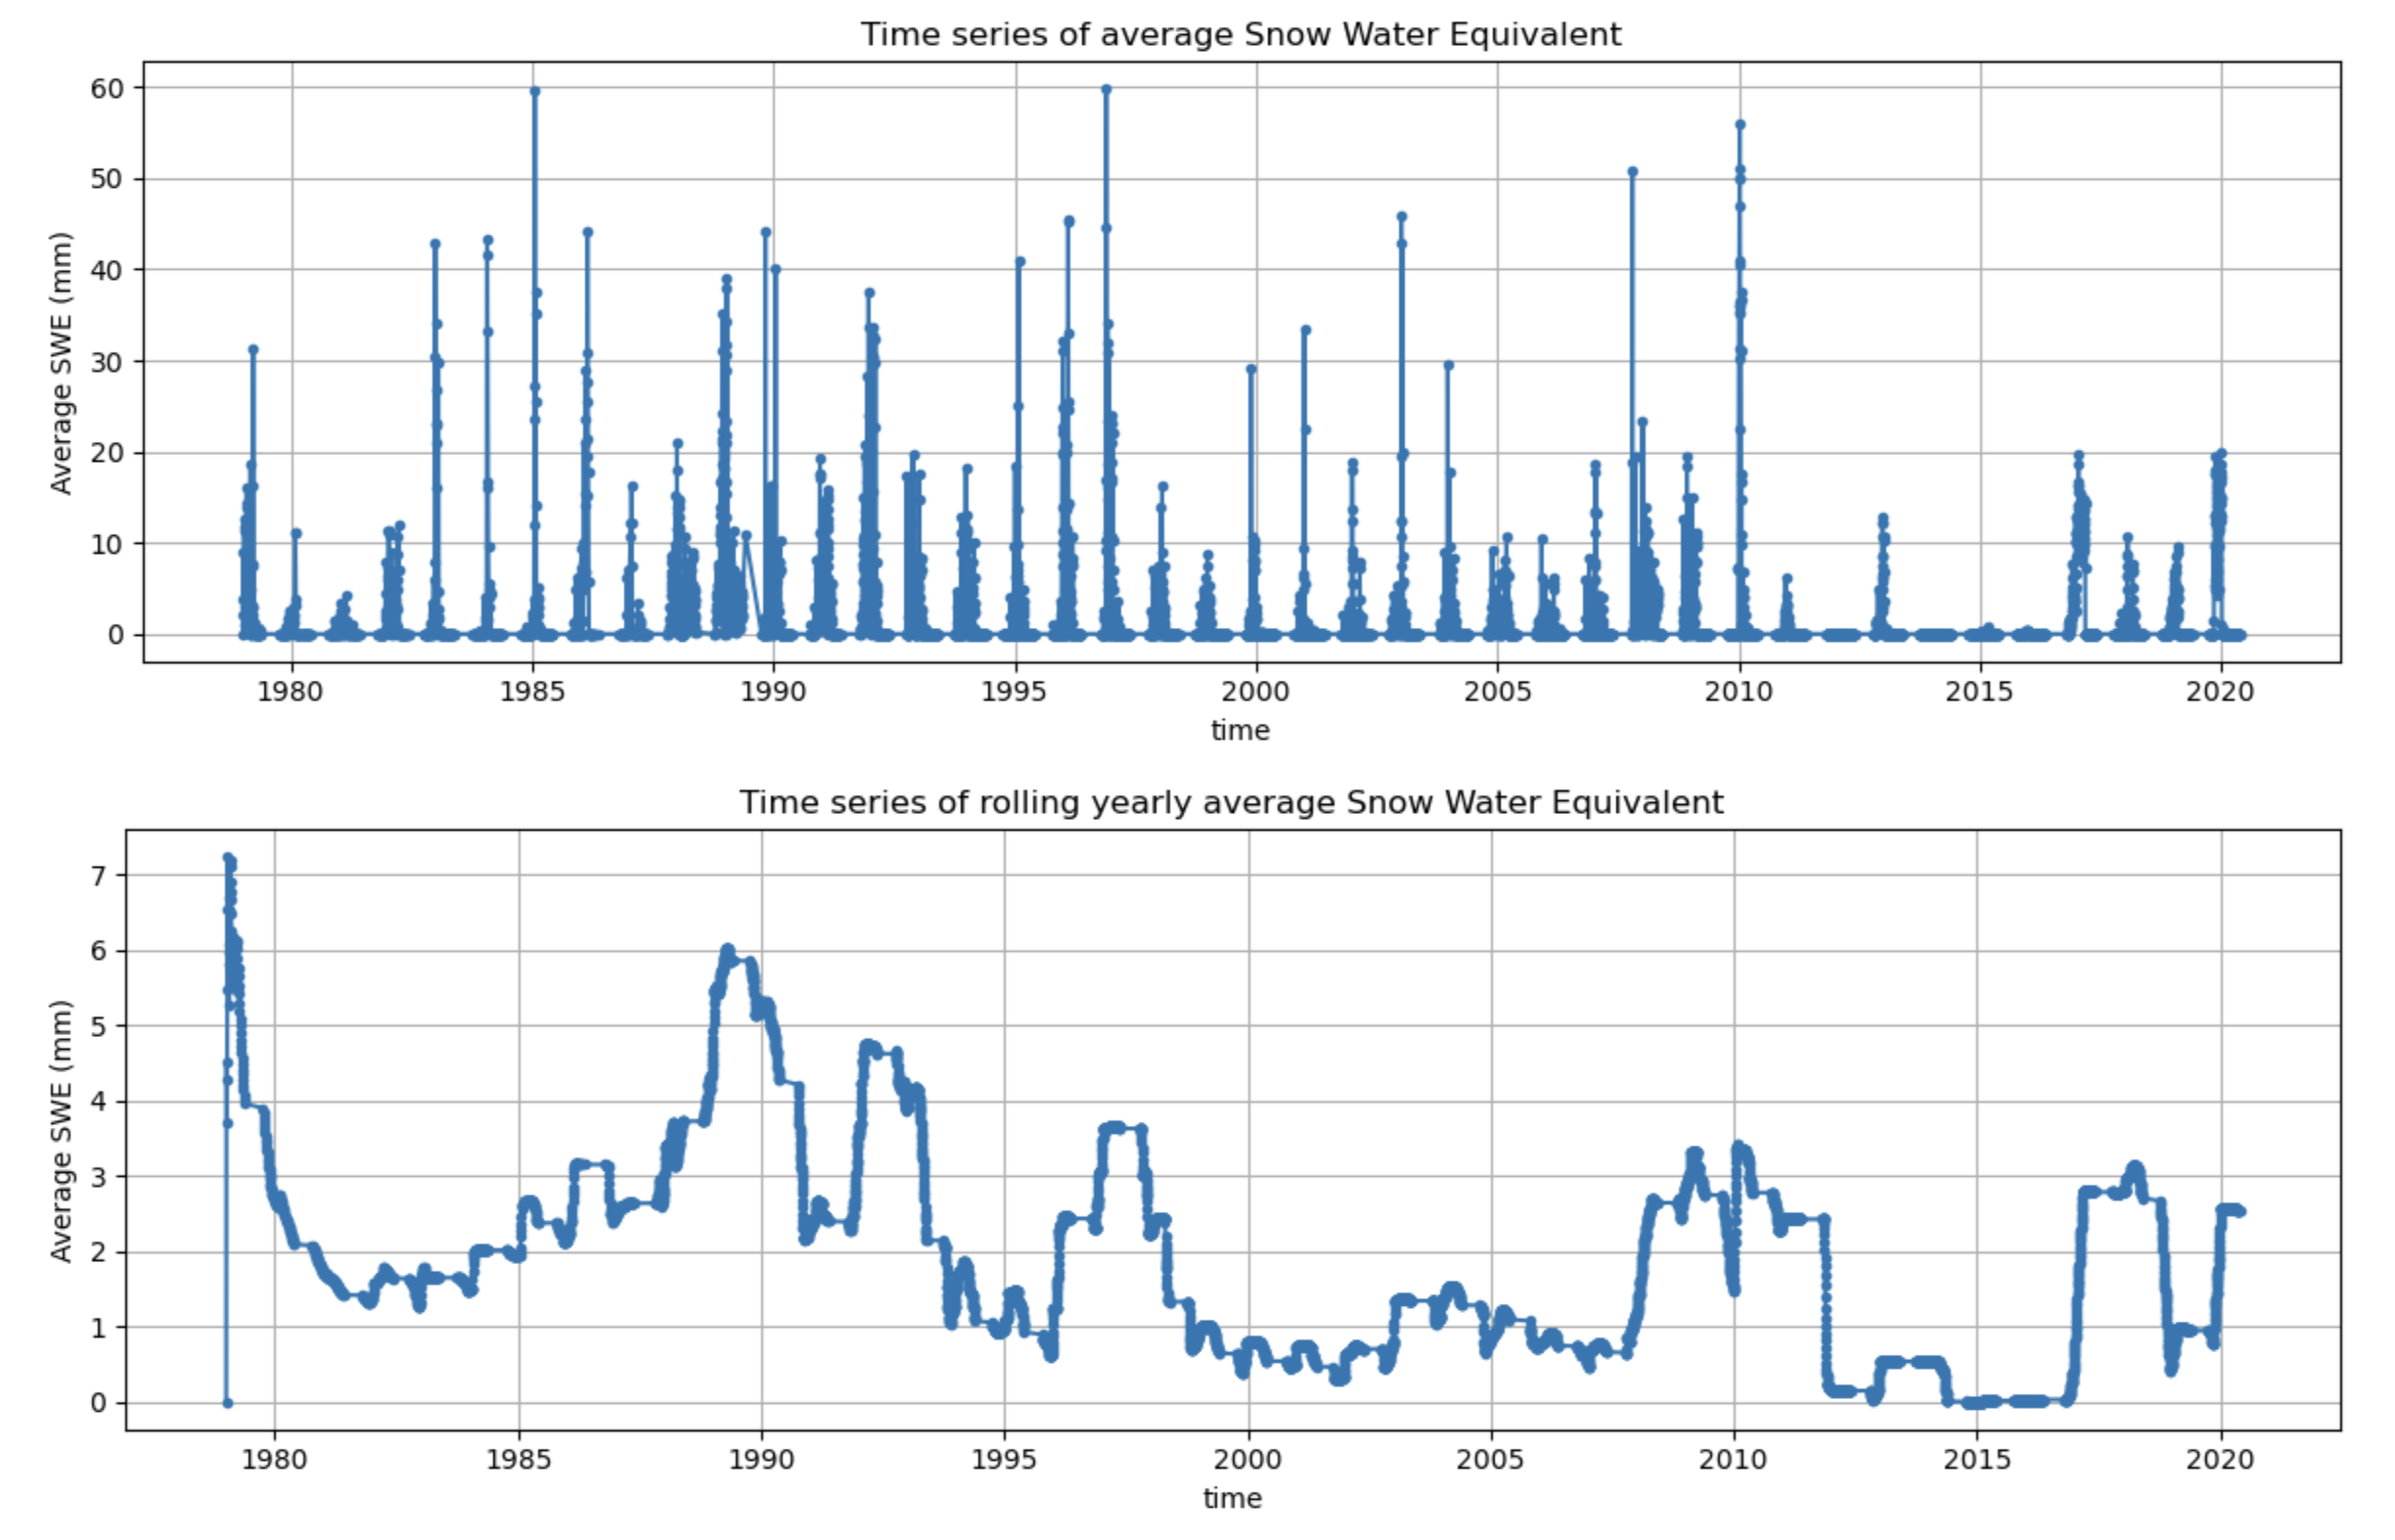
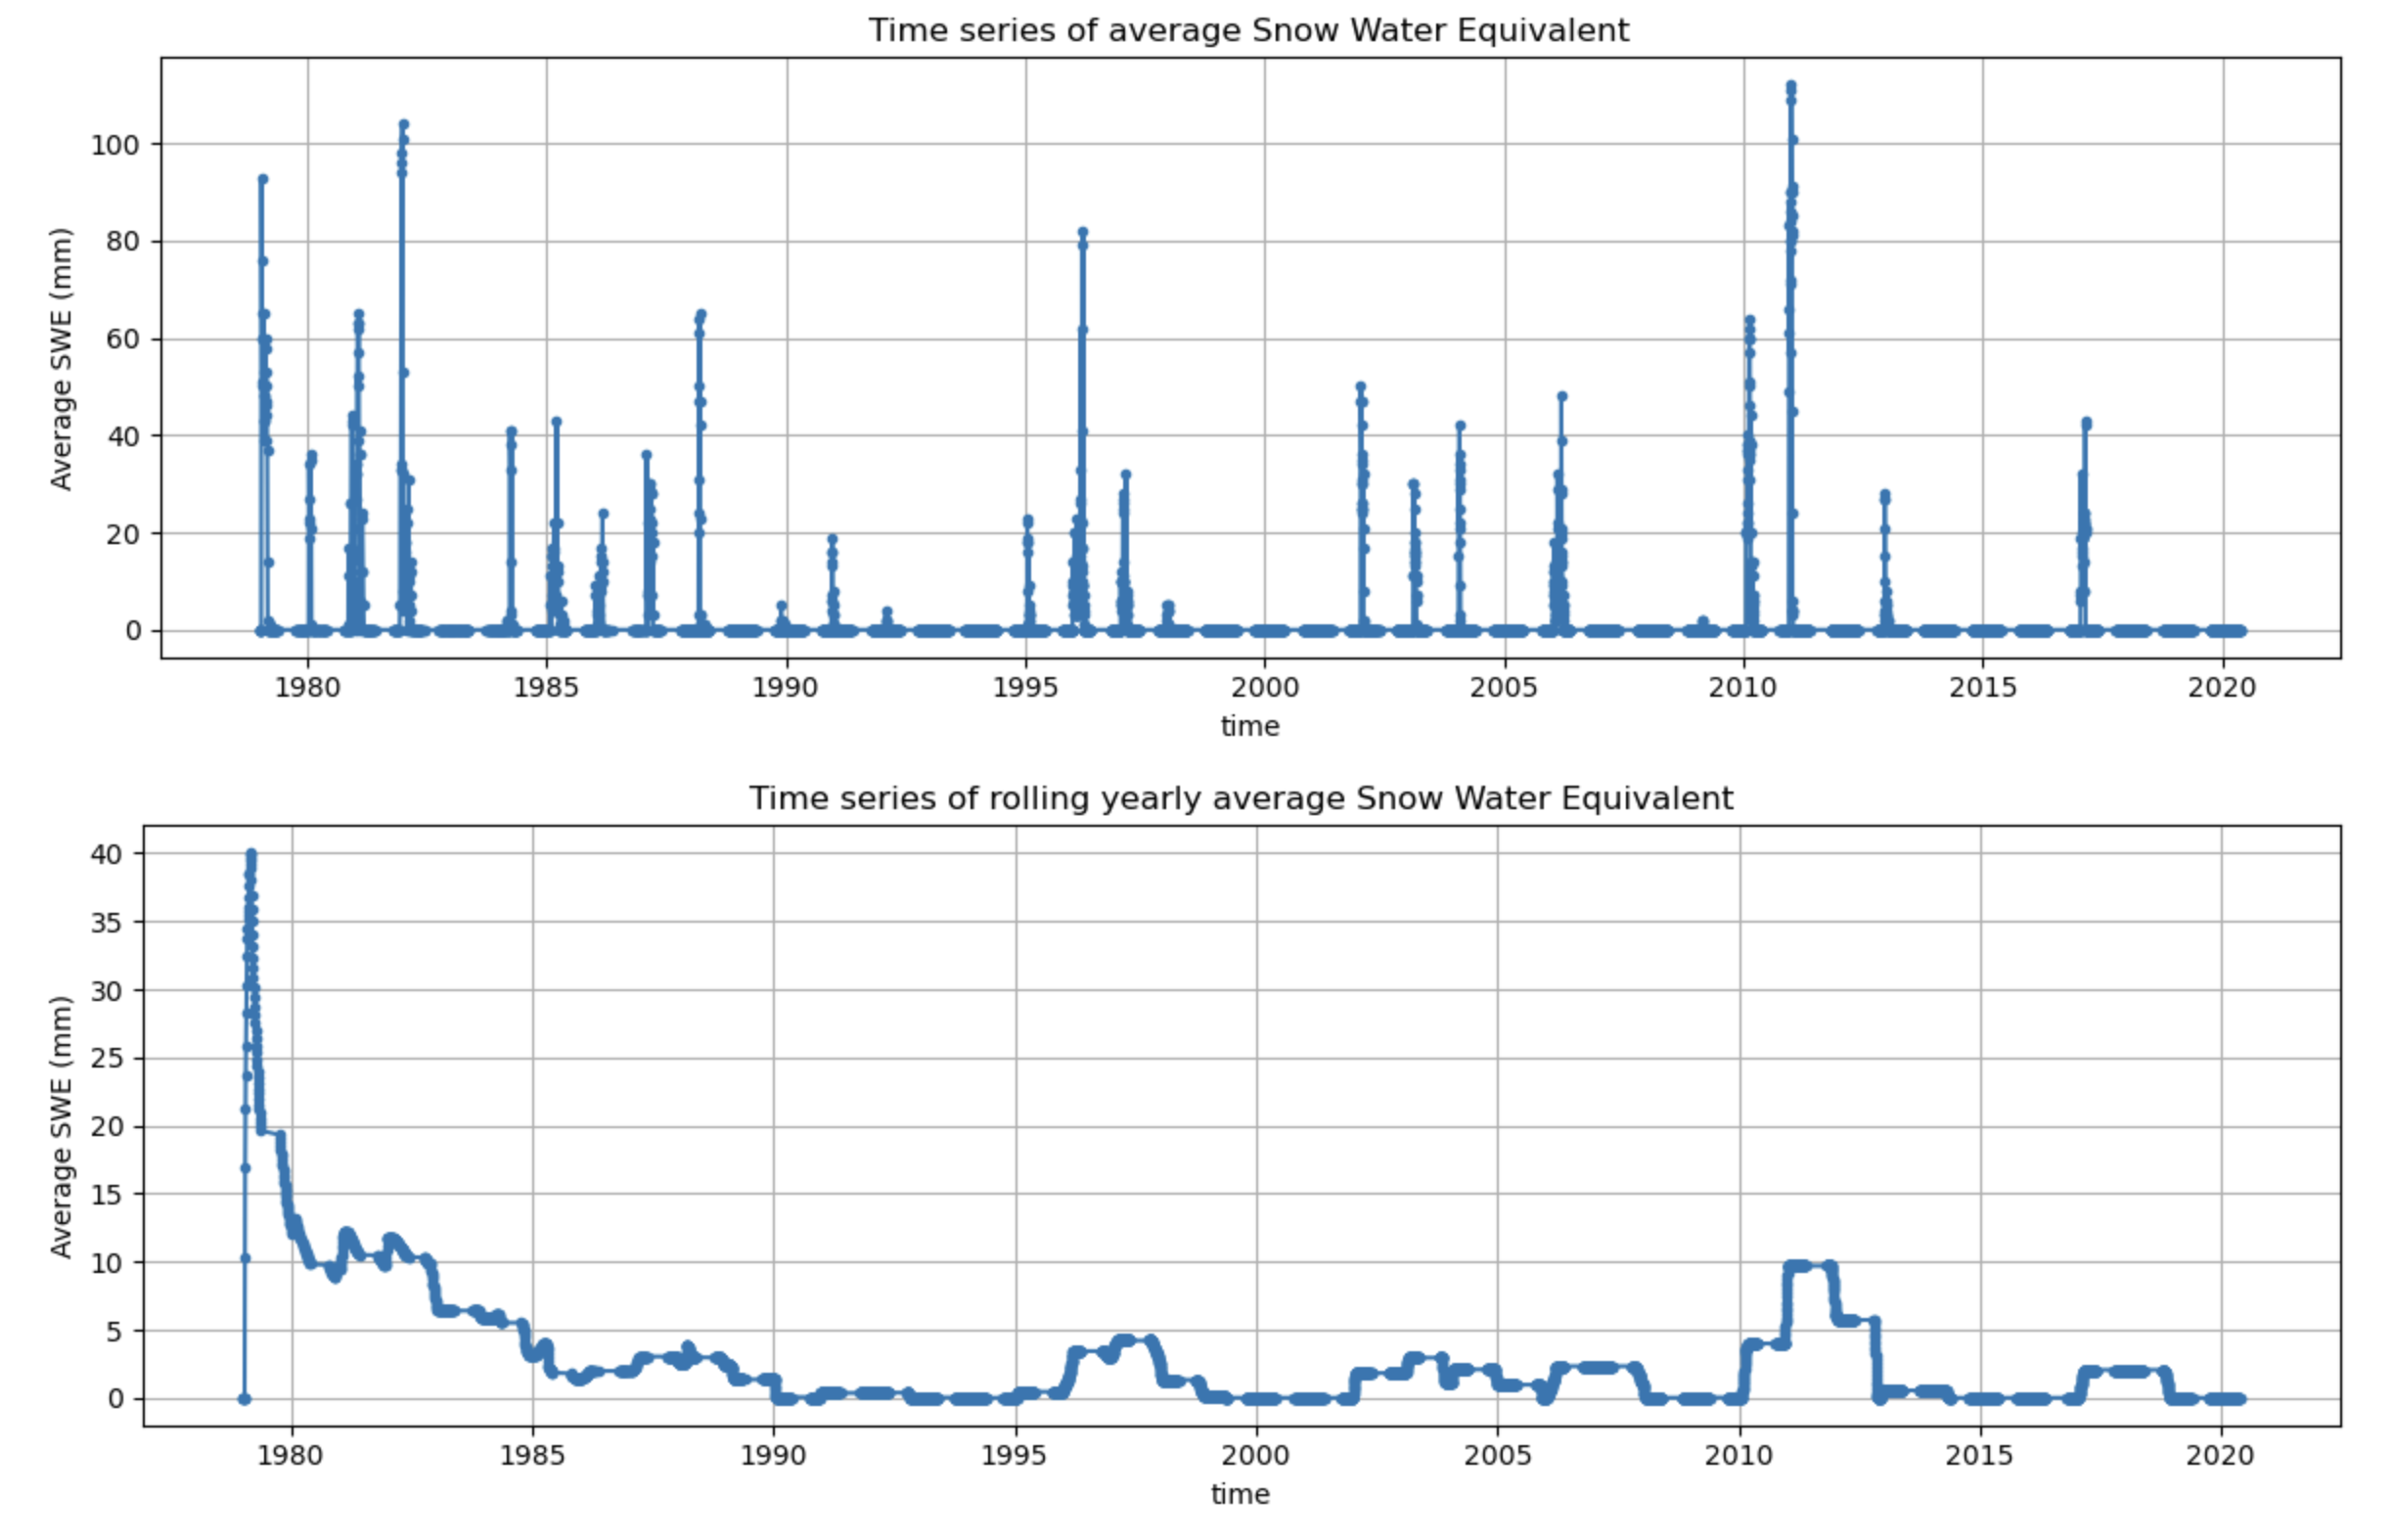
... or sampling the resulting output minimum heights.
The process of extracting the data takes about an hour, so I split this out into a separate notebook which outputs a GeoArrow file in Feather format. If I were to do this again, I'd probably explore the Zarr store over GeoTIFF option, as that may be more more efficient; this would probably replace steps 2 to 4, just with a different cell definition.
I found Kepler.gl really useful as a way to play with this dataset and in particular to see where there may be interesting height cut-points. Note that the Arrow file needed to be saved as uncompressed, as Kepler doesn't yet support compressed GeoArrow.
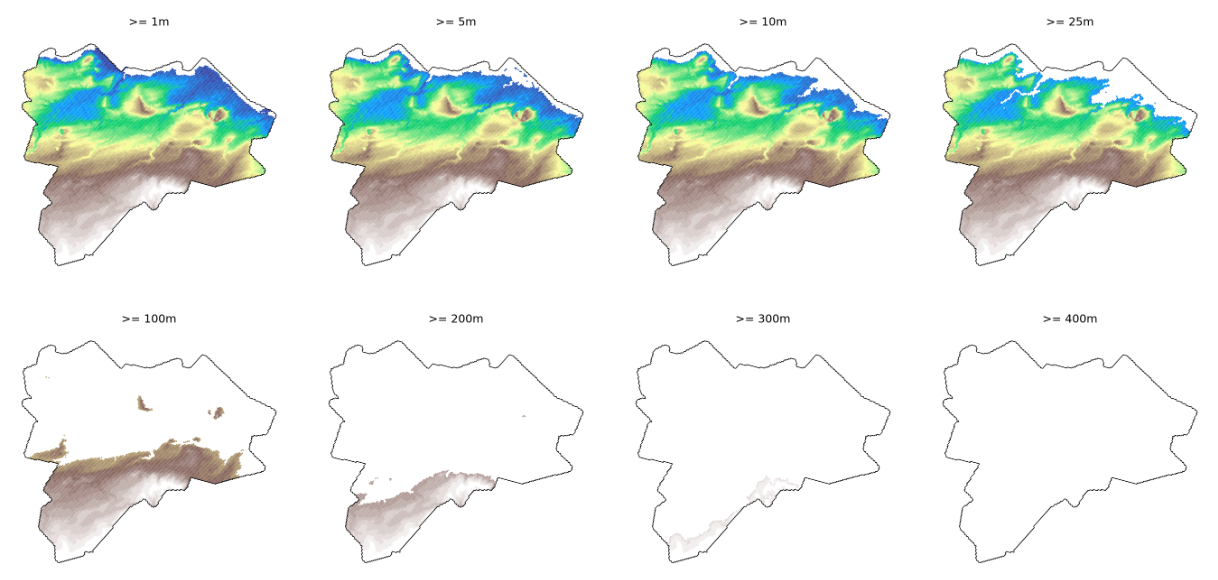
Ultimately, I produced a summary in a another notebook which sliced at different heights, and then I visually compared how this affected the area remaining:
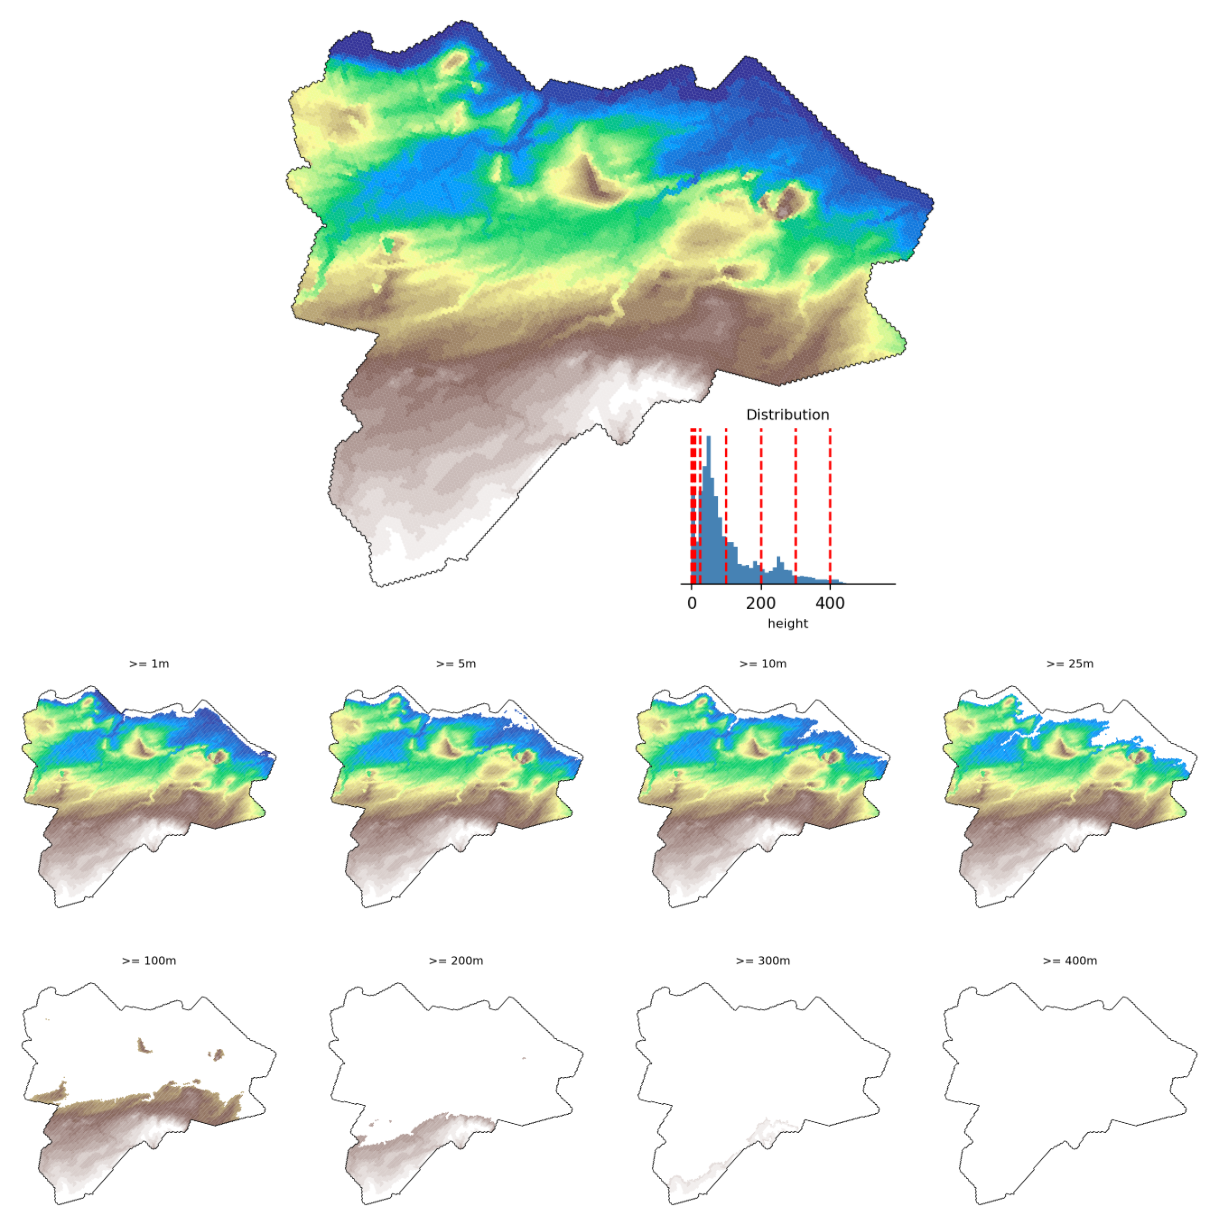
My overall (simplistic) conclusion is that Edinburgh will not be hugely effected, especially if you consider that this is the buffered shape that already includes some sea area. This seems to be consistent with a more rigourous approach from Climate Central looking at, for example, land projected to be below annual flood level in 2110 (red areas):
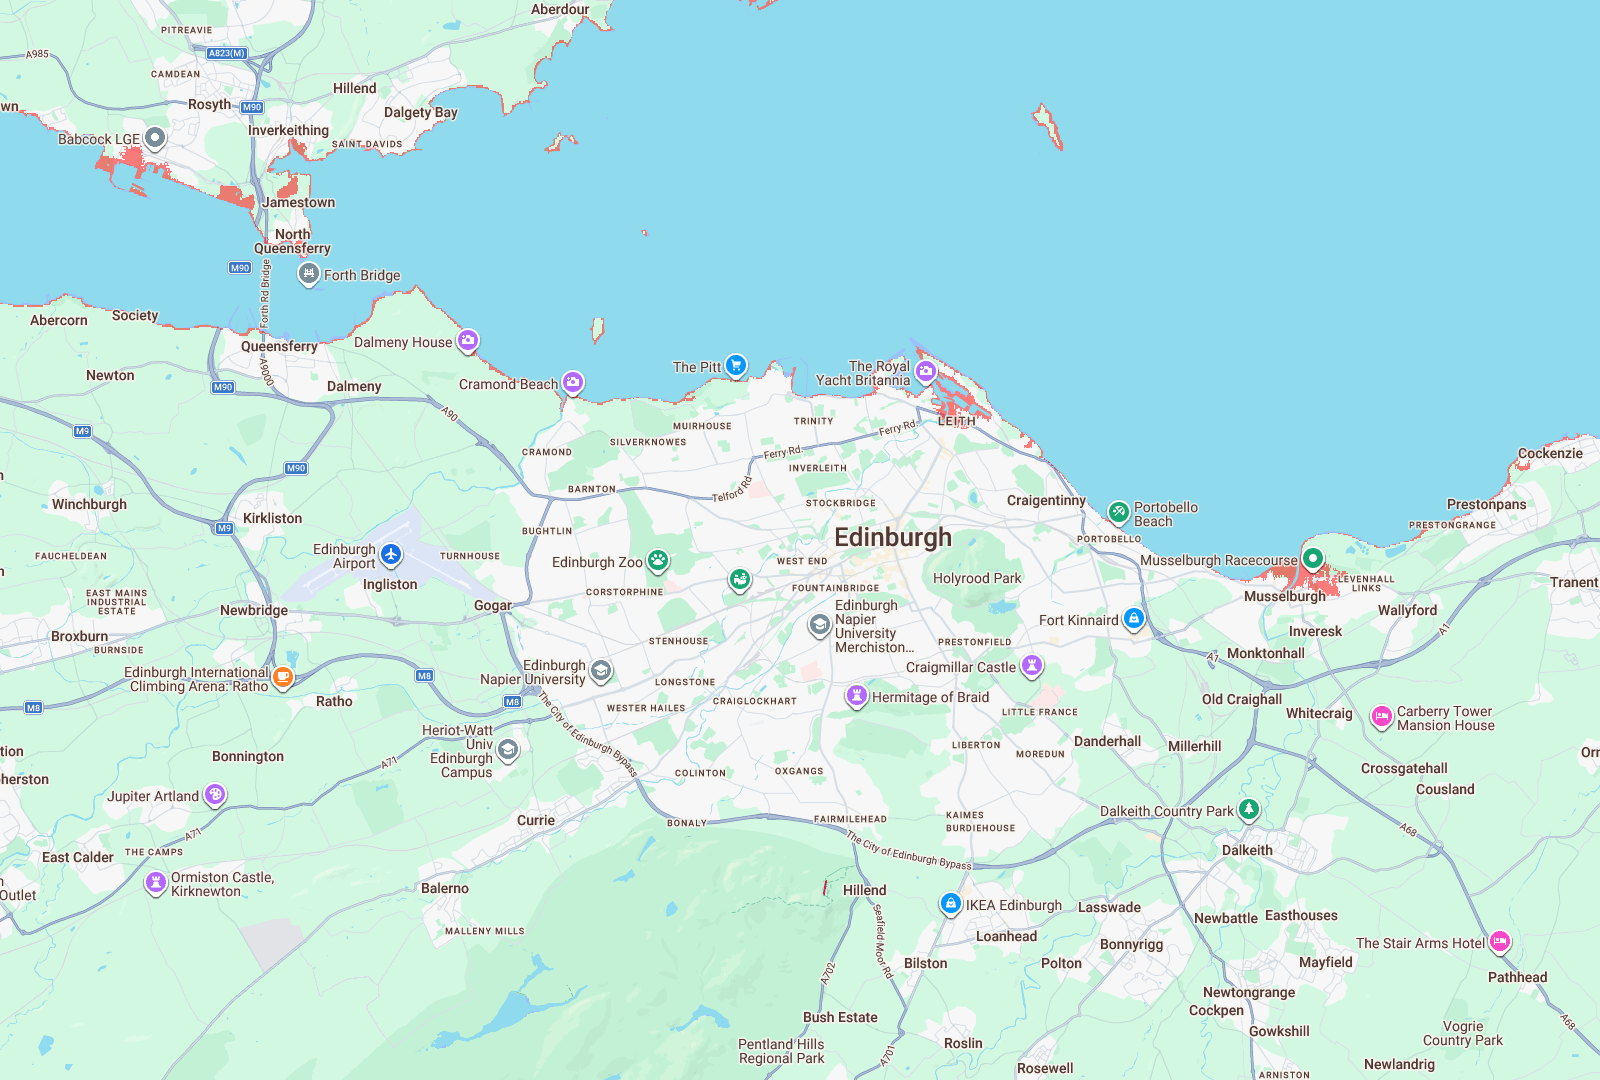
This is obviously devastating for people who live in these areas, and I don't want to minimise that. I'm also sure that Edinburgh as a whole will experience many other negative climactic impacts, but looking purely at direct sea-level rise, it seems to be comparatively spared.